WEB MAPPING SHOWING THE COMMUNITY DISTRIBUTION AND INFRASTRUCTURES IN KANO STATE
Hi Hivians!
Happy Sunday to you, these few days I’ve shared some GIS-related projects and ways they could be carried out. Affirmatively, GIS software has enabled users to view spatial and non-spatial data in its proper format making data interpretation become easier and more understandable. Unfortunately, non-technical users would have difficulty utilizing the software or interpreting what the maps entail. This is what gave rise to Web-map, also referred to as Web GIS, a new technology.
As the name implies, maps displayed on the internet are more accessible for everyone (both experts and non-experts), less costly, and simpler to be shared with other users. Using Kano state as a case study, I will gladly show us how to produce a web map of a particular location.
Methodology:
Outstandingly, we have two methods of carrying out this project. One way is to convert your processed map in the QGIS environment into webmap by installing a plugin called “leaflet.” This method will be shown some other day. Today we will focus on the second method which is coding the project from scratch to the end but attaching some relevant javascript libraries like GeoJSON and leaflet.
Aim
This study examines the most recent Web-GIS technologies in a region of Nigeria, displaying spatial and non-spatial data on their communities and infrastructures on the Internet.
Objectives
Here are the following objectives of the project:
i.To convert the spatial and non-spatial data into geojson.
ii.To import the geojson file into leaflet (javascript library).
iii.To produce a web-map showing local government areas, communities, and their infrastructures in Kano state.
iv.Hosting the web-map on the Netlify platform.
Scope of the project
The scope of work was as follows:
i.Data acquisition
ii.Data sorting
iii.Map production with ArcGIS
iv.Map production with Leaflet
v.Report writing
Data acquisition
The data were collected in MS-EXCEL format with the extension, .csv (Comma Separated Values). For GeoJSON to access the MS-EXCEL file, the extension needs to be .csv before the file can be recognized. The reason GeoJSON was used to encode the spatial and non-spatial data was that the data was very large, with over 4000 communities; to save the stress of typing each of the data, there was a need to use an encoded format to run the task.
Data sorting
When the data was acquired, all of the project information was stored in one file; therefore, data sorting was required to separate the data comprehensively.
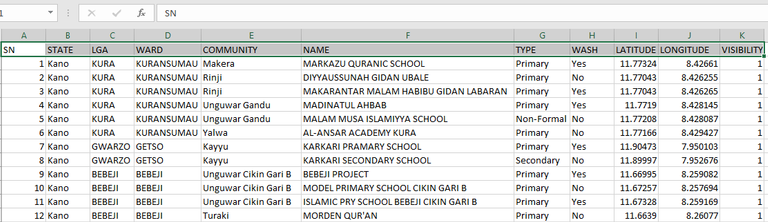
Original Data
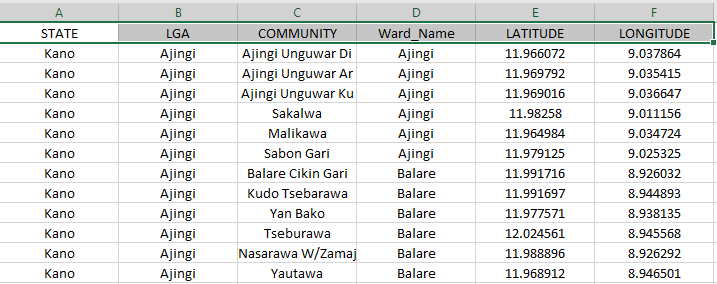
Sorted data
Map production with ArcGIS
An inset map was produced with ArcGIS software showing the local government boundaries in the state boundary. The production process was not explained but definitely hope to discuss that someday too. The purpose of the inset map in the web-map project is to show the map location of each LGAs in the state boundary on the internet.

Inset map popped up on the leaflet marker
As seen in the picture above, the Makoda LGA indicates that it is situated in the northern part of Kano state.
Map Production with Leaflet
The above picture is the landing page that displays the Kano state with the LGAs - Local Government Areas; the numbers 8, and 9 are marker cluster representations indicating the number of LGAs that could be seen once it is zoomed in. Before getting to this final product, commands were encoded in the visual studio to output the results. Since Leaflet is a javascript library, it was easier to produce the result as long as the documentation contains whatever we wanted to do.
How to import the data from GeoJSON to Visual Studio Code
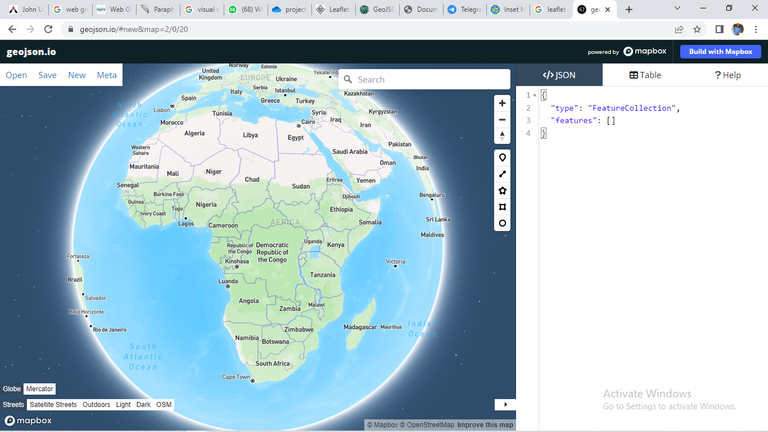
GeoJSON interface
i.The data which were written in the MS-EXCEL file as seen in the sorted data was saved with the extension .csv.
The Open link in the GeoJSON interface
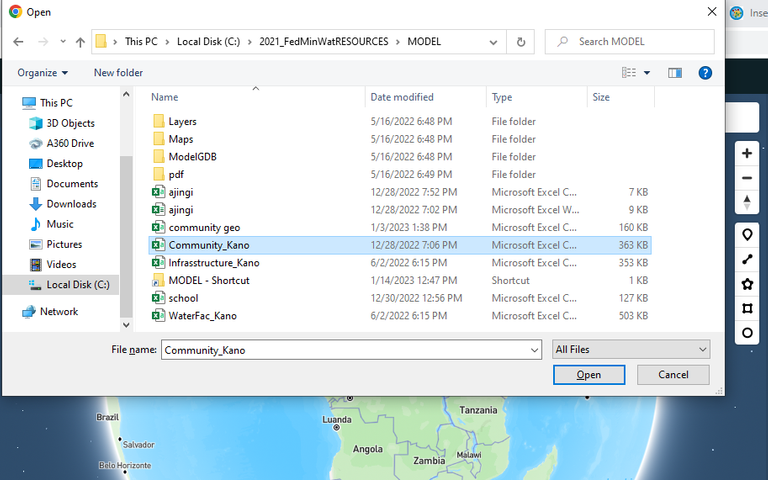
ii.The file is then imported to GeoJSON by:
•Clicking the link, Open as seen in the picture above.
•Choose the desired MS-EXCEL file; as seen in the picture below, Kano community was the desired data in that instance. After clicking the MS-EXCEL, Community_Kano, click the button Open which is indicated with an arrow symbol; then the code was displayed.
Importing MS-EXCEL into the GeoJSON interface
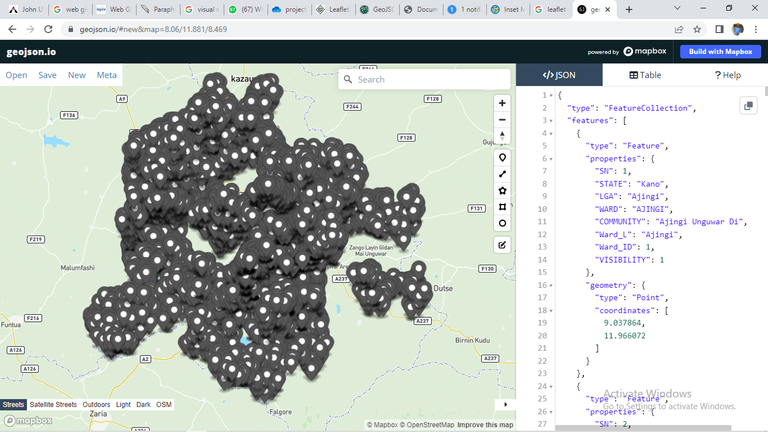
Displayed codes after importing
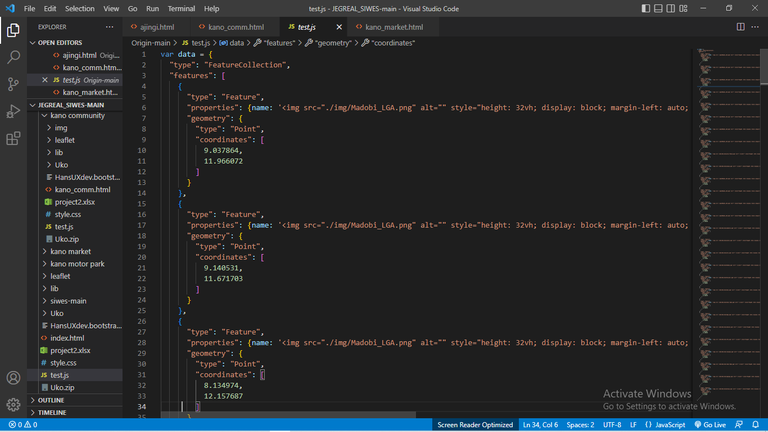
Imported data from GeoJSON to Visual Studio Code
iii.Finally, the GeoJSON codes will be copied to the visual studio code, which is seen in the above picture.
Embellishing Leaflet Map
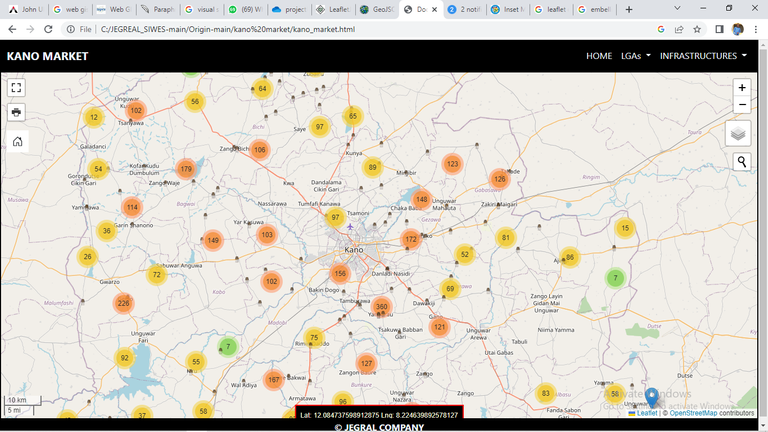
Embellished leaflet map
From the leaflet - javascript library, the following icons were imported to embellish the map:
a.Zoom in/ zoom out
b.Layer control
c.Location search
d.View in fullscreen
e.Print map
f.Zoom to layer
g.Marker cluster
h.Map scale
i.Map coordinate
To insert the above symbols on the leaflet map, I had to carefully understand each of their Leaflet API references. Before then, I assigned a set view for the map; the essence of the set view is to centralize the map in a way that most of the data can be seen at once.
Here are a few API references that give the output in this picture:
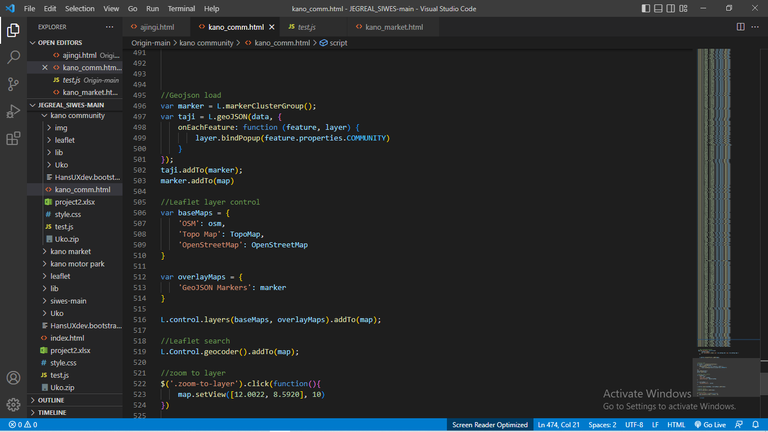
Few codes behind the embellished map
Congratulations @johnuko! You have completed the following achievement on the Hive blockchain And have been rewarded with New badge(s)
You can view your badges on your board and compare yourself to others in the Ranking
If you no longer want to receive notifications, reply to this comment with the word
STOPCheck out our last posts:
Thank you very much @hivebuzz
You're a rockstar @johnuko! Your hard work and dedication have earned you a post every day of the week. Keep spreading the buzz!
Thanks for your contribution to the STEMsocial community. Feel free to join us on discord to get to know the rest of us!
Please consider delegating to the @stemsocial account (85% of the curation rewards are returned).
You may also include @stemsocial as a beneficiary of the rewards of this post to get a stronger support.