Non-spatial Analysis: Using QGIS to show voting pattern
Hi Hivians, I was privileged to work on a BSc. project that involves the use of GIS software for analysis. Below is the report on how I carried it out.
Introduction
This report intends to talk about the different steps employed in GIS to acquire data, process the data and finally present the data in a way that would be useful to non-technical users. In this project, both QGIS was used for data processing and presentation. The methods and steps to process acquired data using QGIS would be explained in detail with the challenges discussed.
Methodology Using QGIS
There are many GIS software that can be used for the processing and visualizing of spatial data, some are open source while some of them are not. QGIS is open source and this section talks about how it can be used for spatial data analysis. The analysis done here was to show the distribution of votes for major political parties across the local government areas of Akwa Ibom State (AKS) in the 2023 gubernatorial elections.
Acquisition of Data (Image of AKS and attribute data)
In GIS, the most important component is DATA, if the methods used to capture data are inaccurate, then the resulting data might lead to errors in the spatial or radiometric components if it is an image or in the spatial component if they are captured using the ground survey method.
In this project, the scanned map of Akwa Ibom State was used as base data to get the spatial information needed, this information was gotten out through digitizing. The attribute data which is the number of votes for the different political parties in the different local government areas in Akwa Ibom State was gotten from the official INEC website, this website was used as the information found there are trusted and does not need verification.
Loading of Data into QGIS
Loading the Scanned Raster Map
when given a scanned map of an area to work within a GIS, the first step is to carry out georeferencing, this process gives the map a real ground coordinate system. This is necessary as even though some data have coordinates, might be in a different system from what one needs to work with, in that case, transformation is done to take it from its present coordinate system to the desired one. In this project, however, the map was a merely scanned map without coordinates and needed to be given coordinates as well as desired datum. The steps below explain how these were achieved.
- Click on “Raster” and then “Georeferencer” on the Toolbar
- When the Georeferencing tab shows up, import the image by clicking on the image icon and specifying the location of the scanned map.
- Set the transformation settings as shown below (Because the coordinates in the map were in GCS, a GCS (WGS 84) was used as the CRS, transformation was then carried out after digitizing to take the map to the required PCS (projected coordinate System)
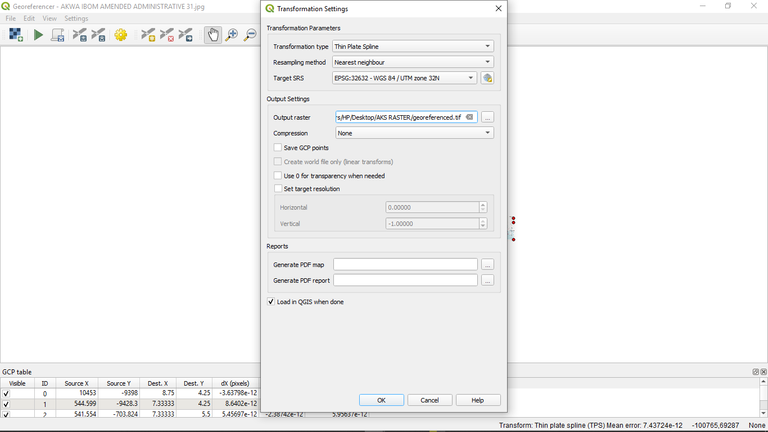
i.When the transformation settings are appropriately done, add georeferencing points (this was done using the provided longitude and latitude points given on the map, a total of six points were used with the residuals confirmed to be okay.) as shown below:

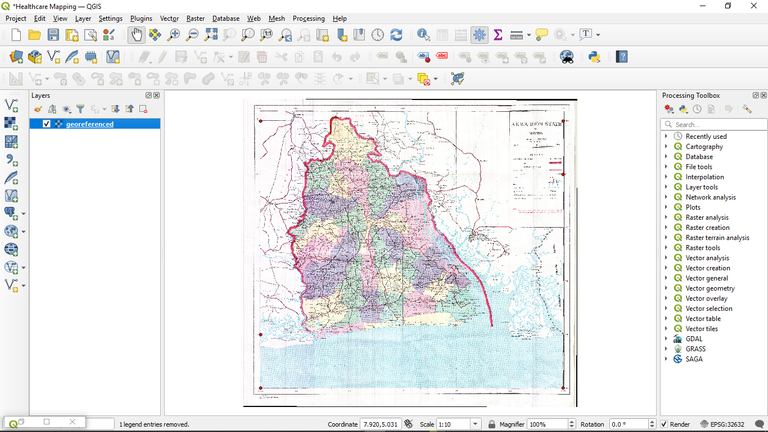
ii.When the transformation and georeferencing are completed, import the georeferenced map to the QGIS as a new raster map layer. This is done by clicking on the import raster maps icon on the manage layer toolbar. These are as shown below:
Digitizing (Error checks and corrections)
Since the kind of data analysis and visualization cannot be done using the scanned raster map available, it was digitized to get vector maps appropriate for the project. The steps for this are outlined below.
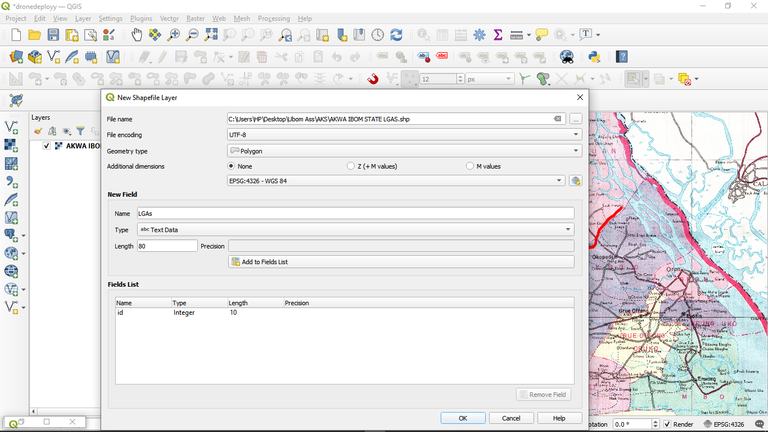
i. This is done by clicking on the New shapefile layer icon on the manage layer toolbar and provide needed information such as the geometry type, number of fields needed, file name, etc. as shown below.
ii.When this is done, select the recently added layer, click on the “toggle editing” icon, then on the “add polygon+” icon and start carefully tracing out the boundaries of the LGAs in the state.
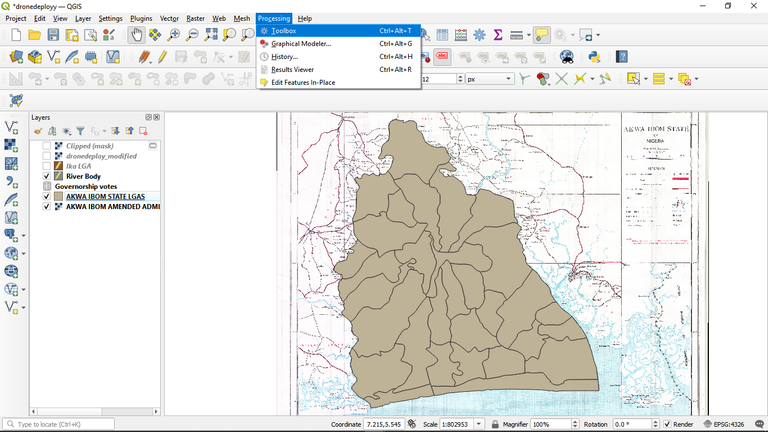
iii.After tracing, the finished vector map is shown below:
The next is to check and correct topological errors, which brings us to the fourth step.
i.Click on the “topology checker” icon on the vector tool bar
ii.Set the errors to avoid such as “No gaps” and “No overlaps”
iii.Few errors were found
iv.The errors were gotten rid of and the vector map was made error-free.
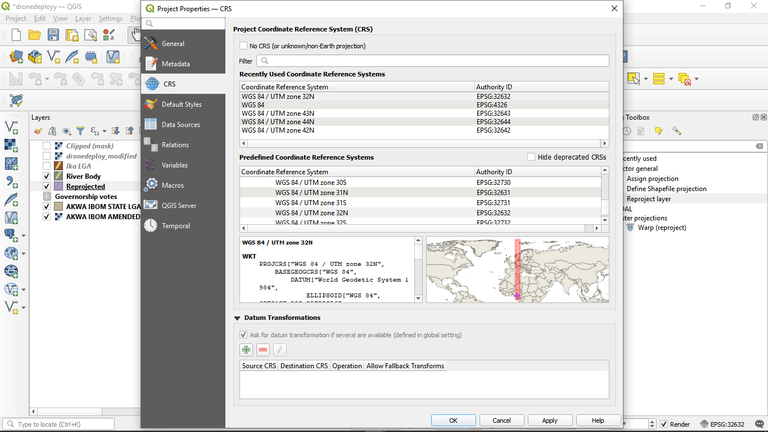
Transforming from GCS to PCS
Since the map is to be produced in WGS84 zone 32 which is a PCS but was georeferenced using a GCS, there is a need to reproject it to the required coordinate system. The following steps were used to achieve that.
i.Click on processing on the Menu bar
ii.Navigate to and click on Toolbox
iii.In the processing Toolbox, search for and click on Reproject
iv.Specify the datum and coordinate system you want (WGS84 zone 32) and save the result as a new shape file as shown below.
Loading Excel Files into QGIS
The spatial data has little or no use without attribute data to do proper description in an analysis such as this. The following steps were used to bring in and spatially join the Excel file that stores the attribute data to the shape file showing the local government areas in Akwa Ibom state.
i.Create a new database on MS Excel
ii.Populate the database with the data gotten from INEC website
iii.Convert the data to QGIS-compatible format which is .csv
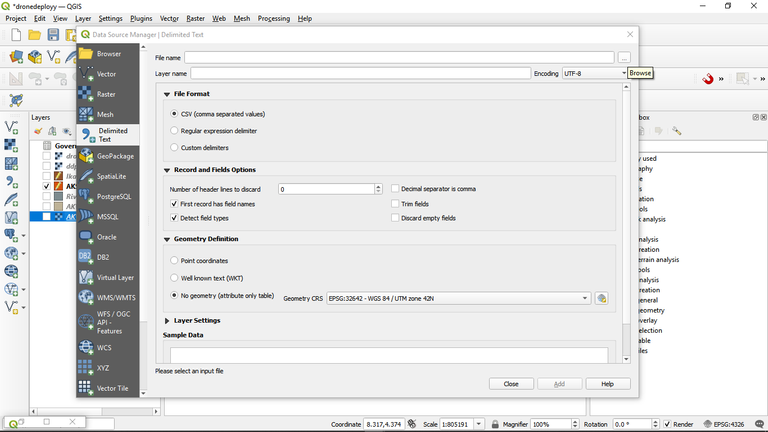
The next steps talk about bringing the data into the QGIS environment
iv.Click on the “Add Delimited” layer in the Manage layer toolbar
v.Select the location of the file and set all required settings in the Data Source Manager as shown below
vi. Add the data
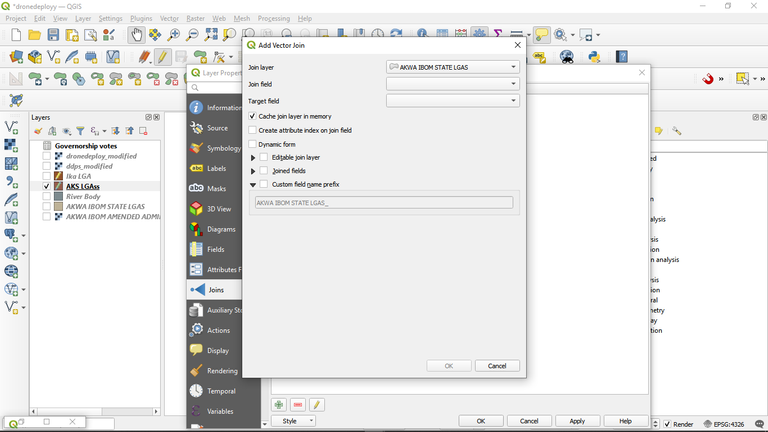
Joining of Excel File to Shapefile
This process is necessary to join the attribute data saved in the Excel file to the shapefile on QGIS. The steps to follow are as shown below.
i.Right-click on the shapefile in question and click on properties
ii.Navigate to and click on Joins
iii.Click on the plus (+) sign in green which represents add new joins
iv.Set the data to be joined, the join field, target field, and every other setting in the add vector join section as shown below
v.Check the attribute table of the shape file to ensure the join is successful
vi.Note that for joins to be successful, all the entities in the join field must be found exactly as they are in the target field. If not, there will be an omission in the resulting attribute table.
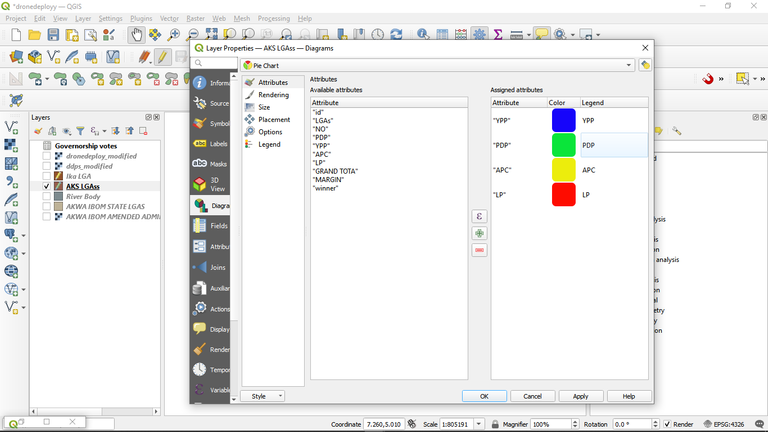
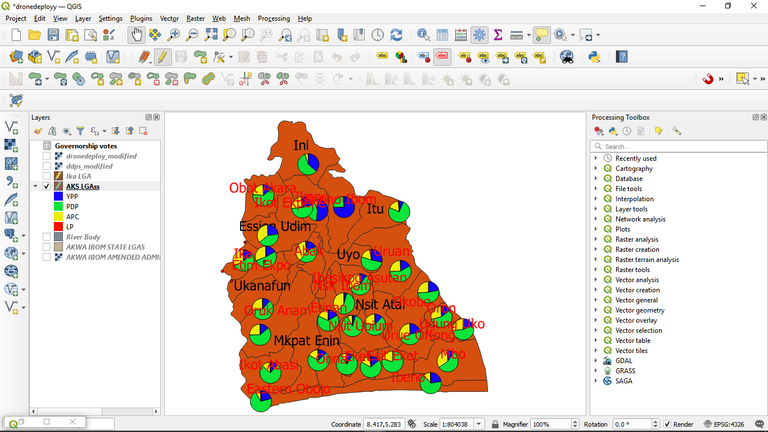
Depiction of distribution of votes across Local Government Areas using Pie Chat
i.Right-click on the shape file and click on properties.
ii.Since we need to visualize more than one data or information at once, we need to use diagrams for this visualization.
iii.Navigate to diagrams
iv.By default, no diagram would be selected so select a preferred diagram which in our case is Piechat.
v.Set the attribute and assign colors and label names as shown below
vi.Also set the placement and size as required and apply.
vii.Visualize the settings to confirm that they appear well and change the settings if they do not. The project was visualized as shown below.
Map Embellishment
This is the final process of the map that involves adding the necessary information needed for a map. The steps are shown below.
i.Click on projects on the menu bar
ii.Navigate to New Print out layer
iii.Set the empty paper that pops up to the preferred paper size as shown below
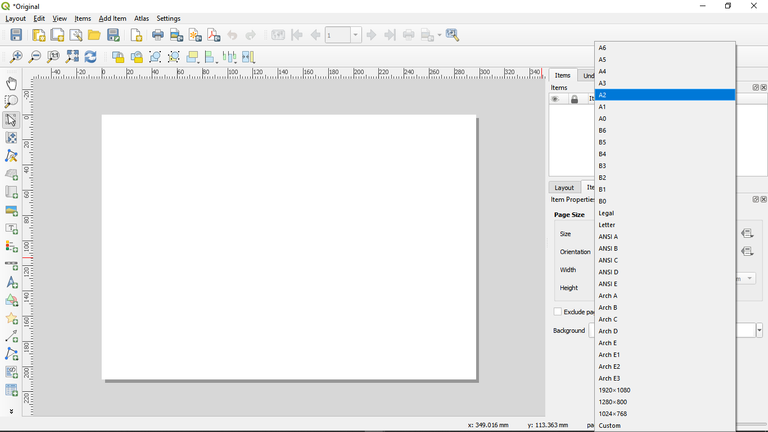
iv.On the menu bar, click on Add Items and add necessary items like the Map, Legend, Scalebar, etc as shown below.
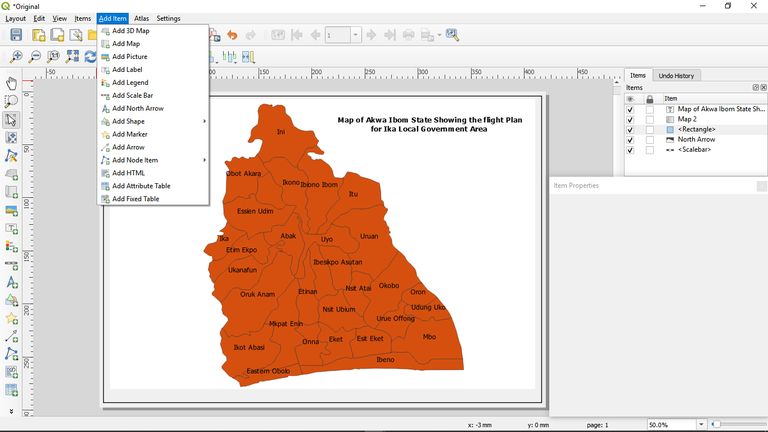
The final embellished map is shown below:
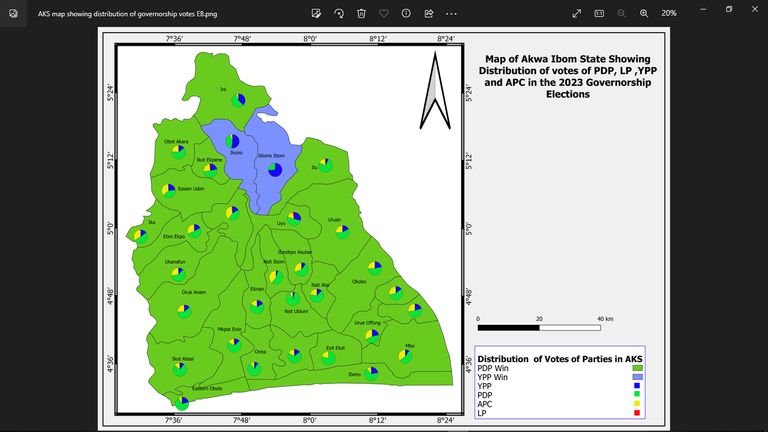
NOTE: The pictures above are screenshots from QGIS interface
Yay! 🤗
Your content has been boosted with Ecency Points, by @hively.
Use Ecency daily to boost your growth on platform!
Support Ecency
Vote for new Proposal
Delegate HP and earn more