Non-Spatial Analysis: Showing voting pattern using ArcGIS
It's a beautiful Thursday, Hivians!
A few days ago I shared a post highlighting the procedures in the analysis of non-spatial data using QGIS. I believe it would be beneficial to you now or someday in the future.
Today I want to share about using another GIS software to analyze non-spatial data. This software is known as ArcGIS. These two software can analyze both spatial and non-spatial data but for the sake of this post, I would explicitly talk about the non-spatial data.
Methodology using ArcGIS
The methodology for ArcGIS is the same as QGIS. The only differences in terms of software are in the settings and arrangements of different tools.
Acquisition of Data
Here, the shapefile of Nigeria which was the area to be mapped was downloaded from DivaGIS as instructed. The attribute data was also gotten from the INEC website as in the case of the data for QGIS.
Loading of acquired data into ArcGIS
The following steps were taken to load up the shape file and Excel file into ArcGIS.
i.The first step is to connect ArcGIS to the folder where the shape file and MS-Excel file are stored.
ii.On the catalog, open up the directory where the files are stored and drag them into the workspace and it would be automatically added as a new layer.
Working with the Shapefile
Since the shapefile was not personally digitized, it went through a topology check and was found to be free from topological errors like gaps and overlaps. The steps employed to carry out topology checks are as seen below.
i.In the folder created for the shapefile, create a new personal geodatabase as shown below.

ii.Rename the geodatabase to a preferred name of your choice.
iii.Create a new feature dataset in the geodatabase with the appropriate coordinate system.
iv.Import the saved shape file into the new feature class created in the geodatabase.
v.Drag the imported file into the workspace.
vi.Start editing the shape file by clicking on the start editing icon as shown below:

vii. Right-click on the feature class, navigate to new, and click on topology as shown below:
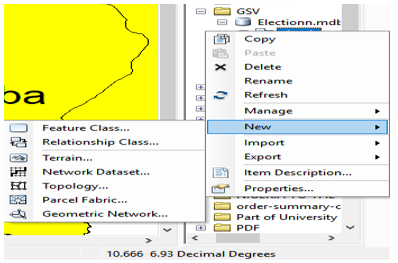
viii.Select the shapefile as shown below

ix.Add rules as shown below
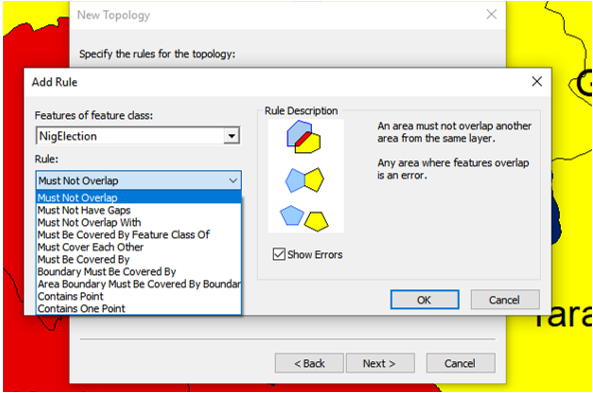
x.Validate topology. It was shown that there were no topological errors as seen below

Joining the Excel File to the shape file
The following steps were followed to achieve this.
i.Right-click on the shape file
ii.Navigate to joins and relates and click on joins as shown below

iii.Set the data to be joined, the join field, target field, and every other setting in the add vector join section as shown below.
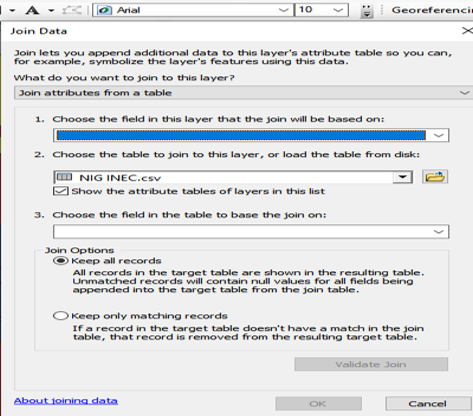
iv.Validate join
v.Open the attribute table of the shapefile to confirm that the join was successful
Depiction of distribution of votes across states for the major political parties in Nigeria using Bar Chart
The following steps were followed to achieve this:
i.Right-click on the Shapefile to be analyzed and click on properties.
ii.On the layer properties, click on symbology.
iii.Since more than one data are to be visualized, we used the charts.
iv.Set the type of chart, symbol color, and size as seen below:
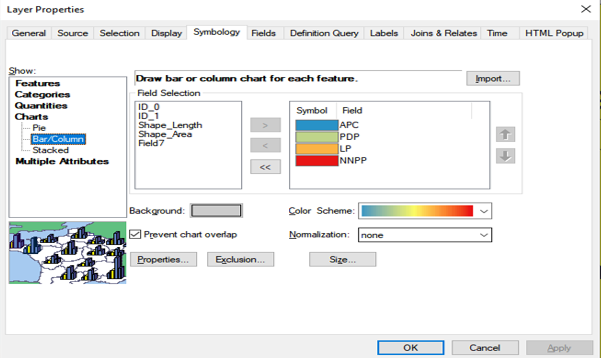
v.Visualize the map to ensure that the sizes and positions are okay.
Mapping the distribution of registered voters across the states in Nigeria.
i.Right-click on the Shape file to be analyzed and click on properties
ii.On the layer properties, click on symbology
iii.Click on quantities and select graduated colors
iv.Select a color ramp
v.Set values, classification type, and number of classes as shown below

vi.Apply the settings and visualize.
Other maps such as maps showing the distribution of accredited voters, maps showing voter turnout, and maps showing winning parties were prepared following the same steps.
Map Embellishment
This is the final process of the map that involves adding the necessary information needed for a map. In ArcGIS, map embellishment is done in the layout view. The steps are shown below.
i.Switch to the layout view
ii.Set the paper size by right-clicking on the page, then select page and print setup
iii.Set the page and other information on the page shown below

iv.As seen in the image above, the paper size was set to A0, this is because all four maps are to be printed on one paper using different layers, therefore, four layers were created as against the usual one layer.
v.When the paper size is set, other information such as the scale, title true north, etc was added as seen below.
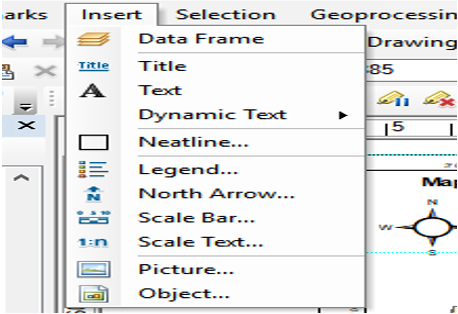
vi.The grid is set by right-clicking on the layer, select properties, and then grid
vii.Select new grid
viii.Set all properties and add grid
The embellished map is as seen below.

Thanks for your contribution to the STEMsocial community. Feel free to join us on discord to get to know the rest of us!
Please consider delegating to the @stemsocial account (85% of the curation rewards are returned).
You may also include @stemsocial as a beneficiary of the rewards of this post to get a stronger support.
Congratulations @johnuko! You have completed the following achievement on the Hive blockchain And have been rewarded with New badge(s)
Your next target is to reach 1500 comments.
You can view your badges on your board and compare yourself to others in the Ranking
If you no longer want to receive notifications, reply to this comment with the word
STOPTo support your work, I also upvoted your post!
Check out our last posts:
Thank you very much 😊 @hivebuzz
That's great @johnuko! We're here to encourage you to achieve your next goals on Hive!