HOW TO CLIP A POLYGON (VECTOR DATA) FROM THE SATELLITE IMAGE (RASTER IMAGE) USING Q-GIS
In my previous post, I shared the procedures for carrying out the installation of a satellite image, using LandSAT-7 as a case study. Today, I want to share to give a detailed procedure on how to clip a polygon from a satellite image.
The essence of carrying out this process is to aid in the supervised and unsupervised classification of the land cover features. Moreso, to easily assess the accuracy of the case study, it is necessary to clip the exact location needed.
Using the Q-GIS interface, the following procedures were carried out to clip the vector polygon (study area) from the raster image (satellite images). The same procedure is applicable to both LandSAT-7 and Sentinel-2.
Step 1:
Once the Q-GIS interface is launched, import both the raster and vector data which consist of the satellite images and study area polygon respectively by clicking the “Add layer” option which is located in the “Layer” menu toolbar.
Step 2:
After importing the raster data, the LandSAT image appears in two colors (black and white). To make the image appear in its respective bands you carry out the following:
a. A plugin called “SCP – Semi-automatic Classification Plugin” is installed to aid the pre-processing and post-processing of satellite images.
b. After installing the SCP, click on the “Band set” option in the SCP toolbar.
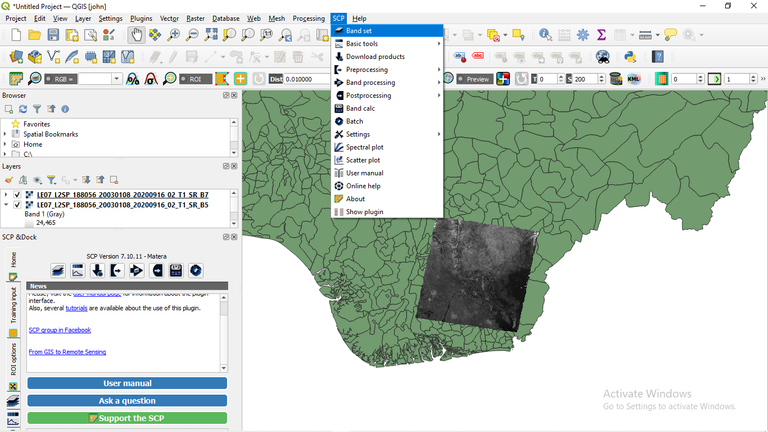
Band set option in the SCP toolbar
c. In the “Band set” interface, click the “Refresh list” to load the LandSAT-7 bands
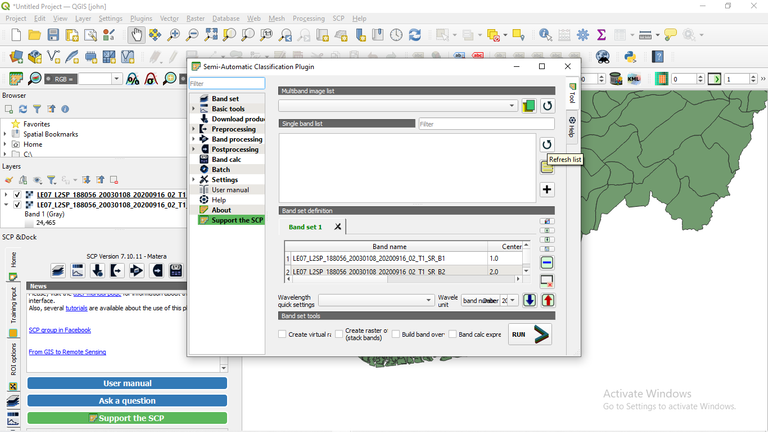
Band set interface displaying the Refresh list
d. When the bands are being loaded, click “Add band to bandset” option to add the LandSAT-7 in the “Band set definition” interface; thereafter you ensure the bands are well arranged.
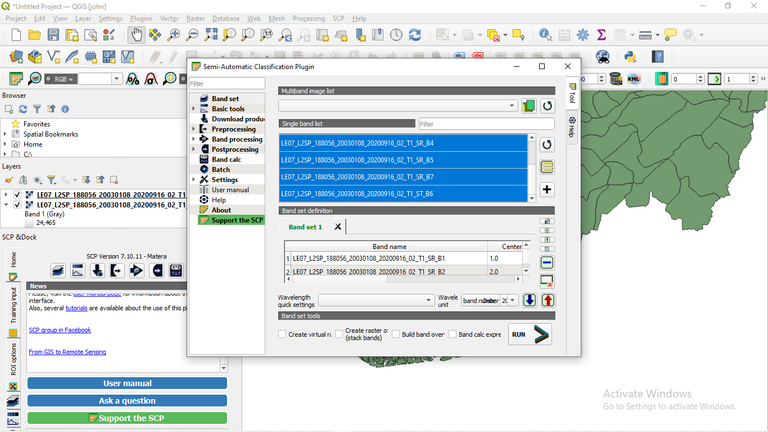
LandSAT-7 bands loaded in the band set definition interface
e. After arranging bands, select the RGB color composite that is suitable for the LandSat-7 bands. As seen in the figure below, RGB 3-2-1 was used.
Thereafter a new raster data “virtual band set” was displayed.
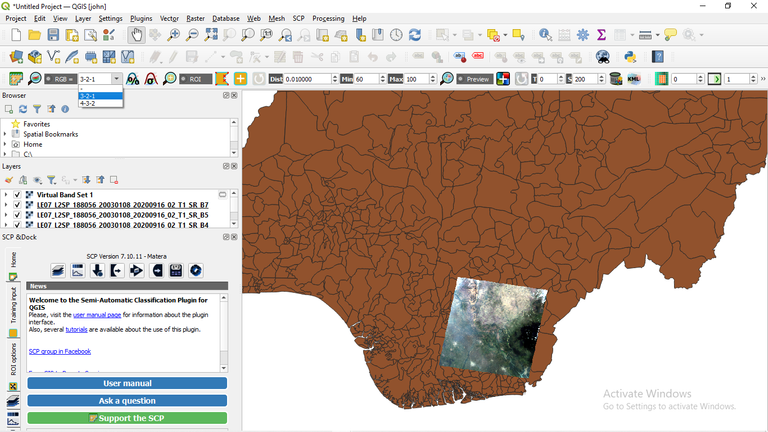
Selecting an RGB composite
Step 3:
Select the area of study by clicking the “Select features by area or Single click” option, then you choose the study area ensuring the color is hollow.
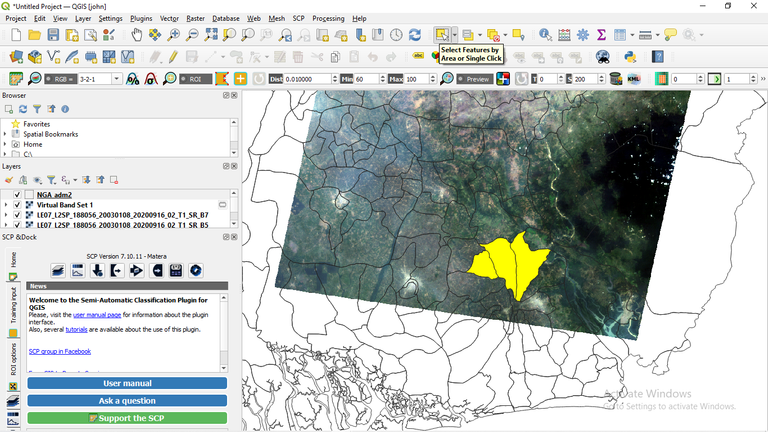
Overlaying the study area on the LandSAT-7 image
Step 4:
To clip the study area (vector data) from the LandSAT-7 image (raster), the following is carried out:
a. In the raster toolbar, select the “extraction” option, then click “clip raster by masked layer”
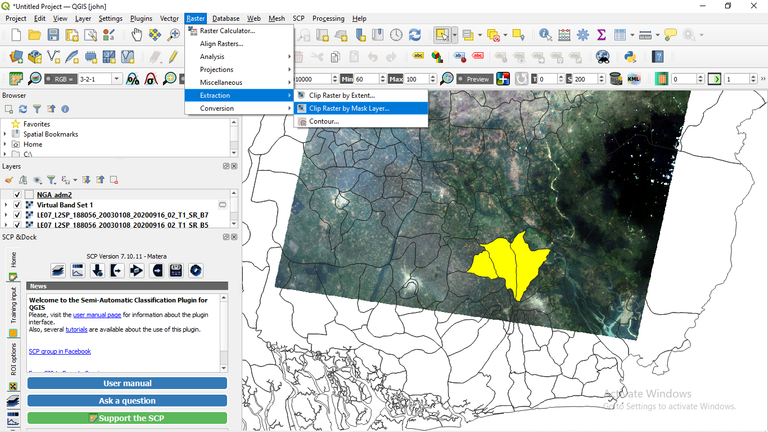
Selecting the “clip raster by masked layer”
b. In the clip raster by masked layer interface, select the “virtual band set” as the input layer then choose the default coordinate reference system as seen below and click “Run.”
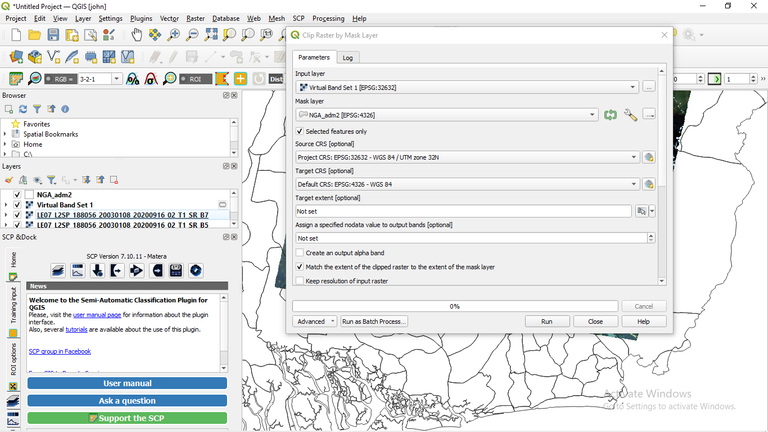
Clip raster by masked layer interface
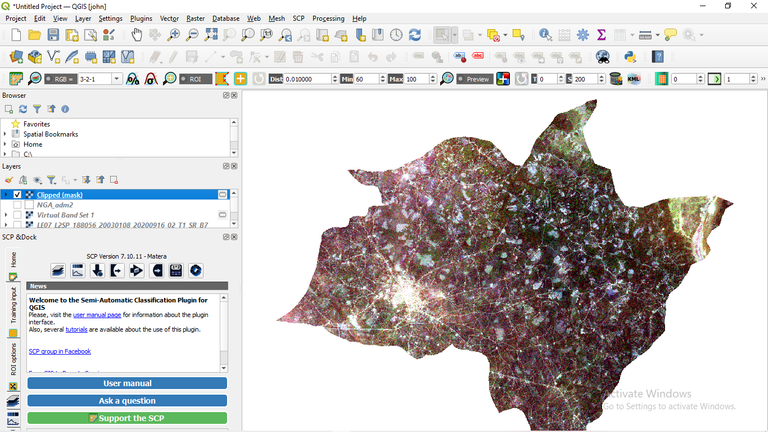
Clip raster output
Thanks for your contribution to the STEMsocial community. Feel free to join us on discord to get to know the rest of us!
Please consider delegating to the @stemsocial account (85% of the curation rewards are returned).
You may also include @stemsocial as a beneficiary of the rewards of this post to get a stronger support.
Well details post thanks for sharing
Thank you for stopping by
It's my pleasure stopping by