Pandas #2: Reading and Cleaning Data with Pandas / Pandas #2: Leyendo y Limpiando Datos con Pandas - Coding Basics #35
An Ideal Dataset

Shoutout to MIT Docubase

In this article you will find
- Introduction
- Reading the data
- Cleaning the Data
- Fixing cells with null values
- Arranging cells with different formats
- Fixing cells with incorrect values
- Fixing Duplicate Rows
Greetings to all. In the previous edition of Coding Basics we talked about the basic principles of Pandas, what it is used for, and the concepts of Series and DataFrames.
Now, it's time to take a closer look at one of the features of Pandas: How to obtain and clean unwanted information in a Dataset, so that you can expand your range of knowledge and create DataFrames that Pandas can work with.
If you want to become an expert on Pandas, just keep reading.
Reading the data
Shoutout to KeyToDataScience
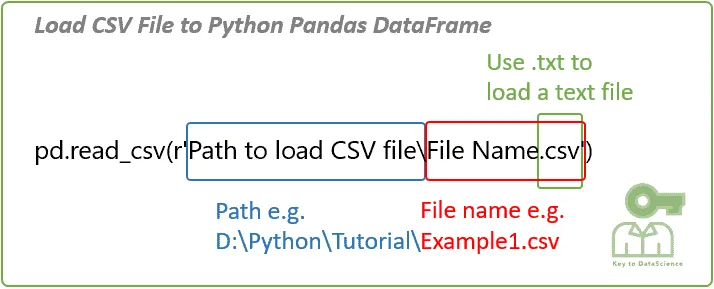
As I had explained in the previous article, the most common way in which information is stored for Datasets is in a csv file, which presents us with a structure quite similar to that of a Dataframe, where the data is organized by rows and columns. introduce.
In the case of pandas, these csv files are opened with the command pandas.read_csv(), where as a parameter we will have the name of the file along with its extension. For example, if we have a Dataset for video games from different companies:
import pandas as pd

df_vids = pd.read_csv('vgsales.csv')

print(df_vids)

>>>
         Rank...Global_Sales
0 1...82.74
1 2 ... 40.24
2 3...35.82
3 4 ... 33.00
4 5 ... 31.37
... ... ... ...
16593 16596 ... 0.01
16594 16597 ... 0.01
16595 16598 ... 0.01
16596 16599 ... 0.01
16597 16600 ... 0.01

[16598 rows x 11 columns]
We can see that here we have 16598 rows and 11 columns. Because displaying 16598 columns upon execution would be an unnecessary memory drain, Pandas shows us the first and last rows. Furthermore, we can see that the columns are abbreviated for the same reason.
If we want to see all the columns, we just have to use the following command before printing:
pd.set_option('display.max_columns', None)
Now, we will no longer have restrictions regarding the number of columns displayed:
         Rank Name Platform\
0 1 Wii Sports Wii
1 2 Super Mario Bros. NES
2 3 Mario Kart Wii Wii
3 4 Wii Sports Resort Wii
4 5 Pokemon Red/Pokemon Blue GB
... ... ... ...
16593 16596 Woody Woodpecker in Crazy Castle 5 GBA
16594 16597 Men in Black II: Alien Escape GC
16595 16598 SCORE International Baja 1000: The Official Game PS2
16596 16599 Know How 2 DS
16597 16600 Spirits & Spells GBA

          Year Genre Publisher NA_Sales EU_Sales JP_Sales \
0 2006.0 Sports Nintendo 41.49 29.02 3.77
1 1985.0 Platform Nintendo 29.08 3.58 6.81
2 2008.0 Racing Nintendo 15.85 12.88 3.79
3 2009.0 Sports Nintendo 15.75 11.01 3.28
4 1996.0 Role-Playing Nintendo 11.27 8.89 10.22
... ... ... ... ... ... ...
16593 2002.0 Platform Kemco 0.01 0.00 0.00
16594 2003.0 Shooter Infogrames 0.01 0.00 0.00
16595 2008.0 Racing Activision 0.00 0.00 0.00
16596 2010.0 Puzzle 7G//AMES 0.00 0.01 0.00
16597 2003.0 Platform Wanadoo 0.01 0.00 0.00

        Other_Sales Global_Sales
0 8.46 82.74
1 0.77 40.24
2 3.31 35.82
3 2.96 33.00
4 1.00 31.37
... ... ...
16593 0.00 0.01
16594 0.00 0.01
16595 0.00 0.01
16596 0.00 0.01
16597 0.00 0.01
Here the 11 columns are shown, which, although cut, reveal complete information about the video games.
However, there will be certain cases where we want to show only some columns. If we want, say, to show only the first columns, instead of printing the entire dataframe, we just use the df.head() method, where we use the number of rows as a parameter, starting from the first index that we want to add:
import pandas as pd

df_vids = pd.read_csv('vgsales.csv')

print(df_vids.head(5))

>>>
    Rank Name Platform ... JP_Sales Other_Sales Global_Sales
0 1 Wii Sports Wii ... 3.77 8.46 82.74
1 2 Super Mario Bros. NES ... 6.81 0.77 40.24
2 3 Mario Kart Wii Wii... 3.79 3.31 35.82
3 4 Wii Sports Resort Wii... 3.28 2.96 33.00
4 5 Pokemon Red/Pokemon Blue GB ... 10.22 1.00 31.37

[5 rows x 11 columns]
If we want to show the last rows in the section, we just have to use .tail(), again using the number of rows as a parameter:
import pandas as pd

df_vids = pd.read_csv('vgsales.csv')

print(df_vids.tail(5))

>>>
         Rank...Global_Sales
16593 16596 ... 0.01
16594 16597 ... 0.01
16595 16598 ... 0.01
16596 16599 ... 0.01
16597 16600 ... 0.01

[5 rows x 11 columns]
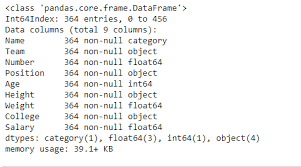
In addition to this, we can see more information about the DataSet in general if we use .info(). This way we can see interesting details such as the datatypes allowed in each column, the number of rows and the number of non-null elements.
<class 'pandas.core.frame.DataFrame'>
RangeIndex: 16598 entries, 0 to 16597
Data columns (total 11 columns):
  # Column Non-Null Count Dtype
--- ------ -------------- -----
  0 Rank 16598 non-null int64
  1 Name 16598 non-null object
  2 Platform 16598 non-null object
  3 Year 16327 non-null float64
  4 Genre 16598 non-null object
  5 Publisher 16540 non-null object
  6 NA_Sales 16598 non-null float64
  7 EU_Sales 16598 non-null float64
  8 JP_Sales 16598 non-null float64
  9 Other_Sales 16598 non-null float64
  10 Global_Sales 16598 non-null float64
dtypes: float64(6), int64(1), object(4)
memory usage: 1.4+ MB
None
But what are non-null values? To understand this in depth, we will head to the next section, where we will talk about data cleansing.
Cleaning the data

Shoutout to Shiksha
Pandas handles enormous amounts of information, and sometimes, those who enter the information can make mistakes or the data can become corrupted. However, if we want to make predictions or use the data efficiently, we must ensure that the information in our DataSet does not produce errors.
This is where the concept of Data Cleaning comes in, which is responsible for fixing or eliminating 'bad' data. What would be these erroneous data in the Datasets?
Among these we can find:
- Cells with null values.
- Incorrectly formatted cells.
- Cells with inappropriate values.
- Duplicate cells.
A cell is simply the data found in a column for a particular row. For example, for the video game dataset, the word Wii within the Platform column at index 0 would be a cell.
Now, let's see how we can fix each type of erroneous data.
Fixing cells with null values
Shoutout to GeeksforGeeks
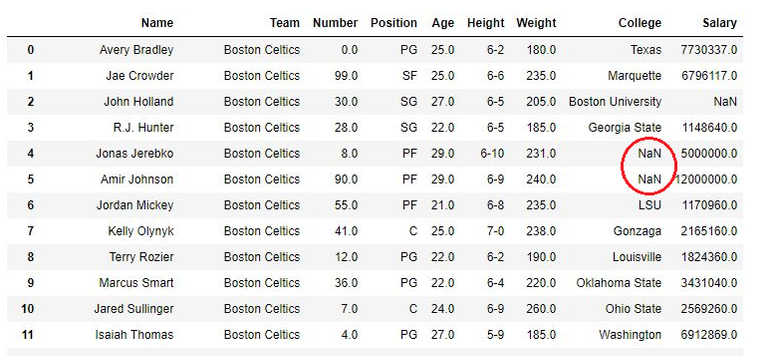
A null value is what appears when, for some reason, no information is entered into a cell, showing us a NaN when we try to see it:
There are two ways to solve this problem:
- Delete the row with the null cell.
- Replace the value of the empty cell with a value that the column accepts.
For example, if we had the DataFrame Professors.csv, with which we will have the subjects, dates, room and teacher name:
   Assignment Day Classroom Professor
0 'Math' '2023/10/11' 'A-01' 'Mr Robinson'
1 'English' '2023/10/12' 'A-02' 'Mrs Gray'
2 'Spanish' NaN 'A-03' 'Mr. Stefan'
If we wanted to delete the last row, we should use dropna(), a method that allows us to eliminate all rows that have null values:
import pandas as pd

df_prof = pd.read_csv('Professors.csv')
new_prof = df_prof.dropna()

print(new_prof)

>>>
   Assignment Day Classroom Professor
0 'Math' '2023/10/11' 'A-01' 'Mr Robinson'
1 'English' '2023/10/12' 'A-02' 'Mrs Gray'
However, this has the drawback that once we delete the row, we will have to create another DataFrame with the new values, leaving the first DataFrame intact. If we want to eliminate the rows, modifying the original DataFrame, we will have to use the inplace = True parameter within dropna():
import pandas as pd

df_prof = pd.read_csv('Professors.csv')
df_prof.dropna(inplace = True)

print(df_prof)

>>>
   Assignment Day Classroom Professor
0 'Math' '2023/10/11' 'A-01' 'Mr Robinson'
1 'English' '2023/10/12' 'A-02' 'Mrs Gray'
The other way we can handle the empty row situation is to replace these with a current value. We do this with fillna, which will allow us to enter a default value as a positional argument for those rows that do not have any value.
import pandas as pd

df_prof = pd.read_csv('Professors.csv')
df_prof.fillna('Undefined', inplace = True)

print(df_prof)

>>>
   Assignment Day Classroom Professor
0 'Math' '2023/10/11' 'A-01' 'Mr Robinson'
1 'English' '2023/10/12' 'A-02' 'Mrs Gray'
2 'Spanish' Undefined 'A-03' 'Mr. Stefan'
Additionally, we can choose to replace only null values for a column we choose using its name. For example, if we applied the following code:
df_prof['Day'].fillna('Undefined', inplace = True)
Then only the NaN values in the Day column will be replaced. If we had an empty cell in the Professor column, it will remain empty.
Arranging cells with different formats
Shoutout to GeeksforGeeks
If the case is that one of the cells has a value that does not match the DataType of the column, we can change it in the following way:
If we take the previous dataset and add a column that has the name of students, we will see the following:
   Assignment Day Classroom Professor Students
0 'Math' '2023/10/11' 'A-01' 'Mr Robinson' 30
1 'English' '2023/10/12' 'A-02' 'Mrs Gray' "36"
2 'Spanish' NaN 'A-03' 'Mr. Stefan' 24
Here we will see that the second row does not match the previous DataTypes, which are of type int, while this is a string. If we want to convert this cell to an integer value, we will have to use the pandas astype method, with which we will only have to enter the type of value as a parameter:
df_prof['Students'] = df_prof['Students'].astype(int)

print(df_prof.Students)
>>>
   Assignment Day Classroom Professor Students
0 'Math' '2023/10/11' 'A-01' 'Mr Robinson' 30
1 'English' '2023/10/12' 'A-02' 'Mrs Gray' 36
2 'Spanish' NaN 'A-03' 'Mr. Stefan' 24
With which we will now have all the values of the Students column as int.
Fixing cells with incorrect values
Shoutout to Sharp Sight
There will be cases where the DataTypes of a cell cannot be converted to match those of the column or a value is placed very above or very below the common range. For example:
   Assignment Day Classroom Professor Students
0 'Math' '2023/10/11' 'A-01' 'Mr Robinson' 30
1 'English' '2023/10/12' 'A-02' 'Mrs Gray' sdasag
2 'Spanish' NaN 'A-03' 'Mr. Stefan' 24
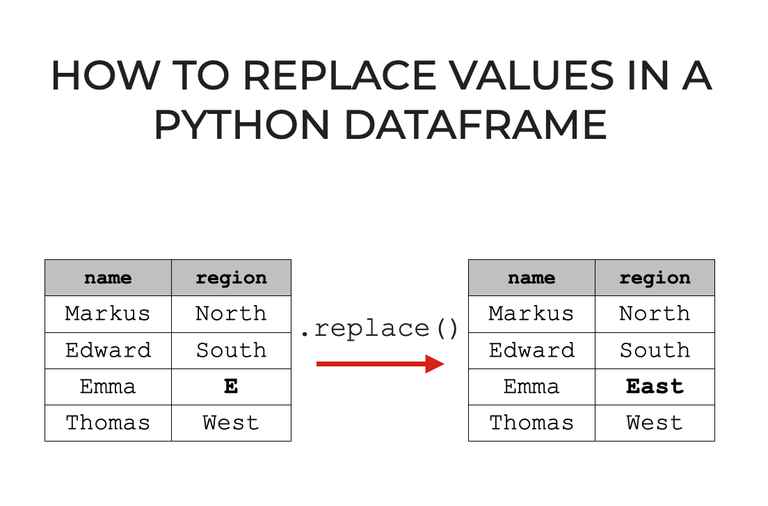
For this case, we can select the specific value and replace it with replace:
import pandas as pd

df_prof = pd.read_csv('Professors.csv')
df_prof.replace('sdasag', 20, inplace=True)

print(df_prof)

>>>
   Assignment Day Classroom Professor Students
0 'Math' '2023/10/11' 'A-01' 'Mr Robinson' 30
1 'English' '2023/10/12' 'A-02' 'Mrs Gray' 20
2 'Spanish' NaN 'A-03' 'Mr. Stefan' 24
In addition to this, for numerical values out of range, we can set conditions. For example, for the following values:
   Assignment Day Classroom Professor Students
0 'Math' '2023/10/11' 'A-01' 'Mr Robinson' 30
1 'English' '2023/10/12' 'A-02' 'Mrs Gray' 60
2 'Spanish' NaN 'A-03' 'Mr. Stefan' 24
If we want the values to not exceed 40 students, then we only have to use the for loop and the conditionals with loc[]:
import pandas as pd

df_prof = pd.read_csv('Professors.csv')

for index in df_prof.index:
     if df_prof.loc[index, 'Students'] > 40:
         df_prof.loc[index, 'Students'] = 40

print(df_prof)
Here we see that we use the .index method to get the number of indexes there are in the DataFrame and we use loc to find the specific element in both row and column. We check if it is greater than 40, and if it is, we preset it as this value:
   Assignment Day Classroom Professor Students
0 'Math' '2023/10/11' 'A-01' 'Mr Robinson' 30
1 'English' '2023/10/12' 'A-02' 'Mrs Gray' 40
2 'Spanish' NaN 'A-03' 'Mr. Stefan' 24
And if we want to delete, we just have to use drop, following the same precepts of dropna:
import pandas as pd

df_prof = pd.read_csv('Professors.csv')

for index in df_prof.index:
if df.loc[index, "Students"] > 40:
df_prof.drop(index, inplace=True)

print(df_prof)

>>>
   Assignment Day Classroom Professor Students
0 'Math' '2023/10/11' 'A-01' 'Mr Robinson' 30
1 'Spanish' NaN 'A-03' 'Mr. Stefan' 24
Fixing Duplicate Rows

Shoutout to GeekPython
Another problem that we must fix is duplicate rows, which can occur due to an error during the writing process and which we eliminate to avoid data redundancy.
The first thing we should do is identify if there is a duplicate row. We can do this with the .duplicated() method, which will do just this. If we have the following DataFrame:
   Assignment Day Classroom Professor Students
0 'Math' '2023/10/11' 'A-01' 'Mr Robinson' 30
1 'English' '2023/10/12' 'A-02' 'Mrs Gray' 60
2 'English' '2023/10/12' 'A-02' 'Mrs Gray' 60
And using duplicated, it will give us False if the row is not duplicated with respect to the previous one, doing the opposite if it is duplicated:
df_prof.duplicated()

>>>
0 False
1 False
2True
dtype: bool
Now that we know there is a duplicate, we will just need to use the drop_duplicates method to remove the duplicates:
df_prof = pd.read_csv('Professors.csv')
df_prof.drop_duplicates(inplace=True)

print(df_prof)

>>>
   Assignment Day Classroom Professor Students
0 'Math' '2023/10/11' 'A-01' 'Mr Robinson' 30
1 'English' '2023/10/12' 'A-02' 'Mrs Gray' 60
And in this way, we will have a DataFrame free of duplicates.
As you can see, keeping data organized, 'clean' and free of errors is one of the priorities for data scientists, who will work with enormous amounts of information and can obtain countless errors if they are not met.
I hope that the following article has provided you with the necessary tools to read and clean data, which will lead you to be much more efficient in your work when analyzing data.
See you on the next episode of Coding Basics!

Un Dataset Ideal
Shoutout to MIT Docubase
En este artículo encontrarás
- Introducción
- Leyendo los datos
- Limpiando los Datos
- Arreglando celdas con valores nulos
- Arreglando celdas con formatos distintos
- Arreglando celdas con valores incorrectos
- Arreglando Filas Duplicadas
Un saludo a todos. En la edición previa de Coding Basics hablamos sobre los principios básicos de Pandas, para que se usa y los conceptos de Series y DataFrames.
Ahora, es tiempo de ver de cerca una de las funcionalidades del Pandas: El como obtener y limpiar información no deseada en un Dataset, esto para que puedas ampliar tu rango de conocimientos y puedas crear DataFrames con los que Pandas pueda trabajar.
Si quieres volverte un experto en Pandas, solo debes de seguir leyendo.
Leyendo los datos
Shoutout to KeyToDataScience
Como había explicado en el artículo anterior, la forma más común en que se almacena la información para Datasets es en un archivo csv, lo cual nos presenta una estructura bastante similar a la de un Dataframe, donde se organizan por filas y columnas los datos a introducir.
En el caso de pandas, esto archivos csv se abren con el comando pandas.read_csv(), donde como parámetro tendremos el nombre del archivo junto a su extensión. Por ejemplo, si tenemos un Dataset para videojuegos de distintas compañías:
import pandas as pd

df_vids = pd.read_csv('vgsales.csv')

print(df_vids)

>>>
        Rank  ... Global_Sales
0          1  ...        82.74
1          2  ...        40.24
2          3  ...        35.82
3          4  ...        33.00
4          5  ...        31.37
...      ...  ...          ...
16593  16596  ...         0.01
16594  16597  ...         0.01
16595  16598  ...         0.01
16596  16599  ...         0.01
16597  16600  ...         0.01

[16598 rows x 11 columns]
Podemos ver que aquí tenemos 16598 filas y 11 columnas. Debido a que mostrar 16598 columnas al ejecutar sería un gasto de memoria innecesario, Pandas nos muestra las primeras y últimas filas. Además, podemos ver que las columnas son abreviadas por la misma razón.
Si queremos ver todas la columnas, solo tenemos que usar el siguiente comando antes de imprimir:
pd.set_option('display.max_columns', None)
Ahora, ya no tendremos restricciones con respecto a la cantidad de columnas que se muestran:
        Rank                                              Name Platform  \
0          1                                        Wii Sports      Wii
1          2                                 Super Mario Bros.      NES
2          3                                    Mario Kart Wii      Wii
3          4                                 Wii Sports Resort      Wii
4          5                          Pokemon Red/Pokemon Blue       GB
...      ...                                               ...      ...
16593  16596                Woody Woodpecker in Crazy Castle 5      GBA
16594  16597                     Men in Black II: Alien Escape       GC
16595  16598  SCORE International Baja 1000: The Official Game      PS2
16596  16599                                        Know How 2       DS
16597  16600                                  Spirits & Spells      GBA

         Year         Genre   Publisher  NA_Sales  EU_Sales  JP_Sales  \
0      2006.0        Sports    Nintendo     41.49     29.02      3.77
1      1985.0      Platform    Nintendo     29.08      3.58      6.81
2      2008.0        Racing    Nintendo     15.85     12.88      3.79
3      2009.0        Sports    Nintendo     15.75     11.01      3.28
4      1996.0  Role-Playing    Nintendo     11.27      8.89     10.22
...       ...           ...         ...       ...       ...       ...
16593  2002.0      Platform       Kemco      0.01      0.00      0.00
16594  2003.0       Shooter  Infogrames      0.01      0.00      0.00
16595  2008.0        Racing  Activision      0.00      0.00      0.00
16596  2010.0        Puzzle    7G//AMES      0.00      0.01      0.00
16597  2003.0      Platform     Wanadoo      0.01      0.00      0.00

       Other_Sales  Global_Sales
0             8.46         82.74
1             0.77         40.24
2             3.31         35.82
3             2.96         33.00
4             1.00         31.37
...            ...           ...
16593         0.00          0.01
16594         0.00          0.01
16595         0.00          0.01
16596         0.00          0.01
16597         0.00          0.01
Aquí se muestran las 11 columnas, que aunque cortadas, nos revelan la información completa sobre los videojuegos.
Sin embargo, existirán ciertos casos donde querramos mostrar solo algunas columnas. Si queremos, digamos mostrar solo las primeras columnas, en vez de imprimir el dataframe completo, solo usamos el método df.head(), donde usamos como parámetro la cantidad de filas, empezando desde el primer índice que queremos agregar:
import pandas as pd

df_vids = pd.read_csv('vgsales.csv')

print(df_vids.head(5))

>>>
   Rank                      Name Platform  ...  JP_Sales Other_Sales Global_Sales
0     1                Wii Sports      Wii  ...      3.77        8.46        82.74
1     2         Super Mario Bros.      NES  ...      6.81        0.77        40.24
2     3            Mario Kart Wii      Wii  ...      3.79        3.31        35.82
3     4         Wii Sports Resort      Wii  ...      3.28        2.96        33.00
4     5  Pokemon Red/Pokemon Blue       GB  ...     10.22        1.00        31.37

[5 rows x 11 columns]
Si queremos mostrar en la sección de las últimas filas, solo tenemos que usar .tail(), de nuevo usando como parámetro la cantidad de filas:
import pandas as pd

df_vids = pd.read_csv('vgsales.csv')

print(df_vids.tail(5))

>>>
        Rank  ... Global_Sales
16593  16596  ...         0.01
16594  16597  ...         0.01
16595  16598  ...         0.01
16596  16599  ...         0.01
16597  16600  ...         0.01

[5 rows x 11 columns]
Además de esto, podemos ver mayor información sobre el DataSet en general si usamos .info(). De esta manera podremos ver detalles interesantes como lo son los datatypes permitidos en cada columna, la cantidad de filas y la cantidad de elementos no nulos.
<class 'pandas.core.frame.DataFrame'>
RangeIndex: 16598 entries, 0 to 16597
Data columns (total 11 columns):
 #   Column        Non-Null Count  Dtype
---  ------        --------------  -----
 0   Rank          16598 non-null  int64
 1   Name          16598 non-null  object
 2   Platform      16598 non-null  object
 3   Year          16327 non-null  float64
 4   Genre         16598 non-null  object
 5   Publisher     16540 non-null  object
 6   NA_Sales      16598 non-null  float64
 7   EU_Sales      16598 non-null  float64
 8   JP_Sales      16598 non-null  float64
 9   Other_Sales   16598 non-null  float64
 10  Global_Sales  16598 non-null  float64
dtypes: float64(6), int64(1), object(4)
memory usage: 1.4+ MB
None
¿Pero que son los valores no nulos? Para comprender esto en profundidad, nos dirigiremos a la siguiente sección, donde hablaremos sobre la limpieza de datos.
Limpiando los datos
Shoutout to Shiksha
Pandas maneja enormes cantidades de información, y a veces, aquellas personas que introducen la información pueden equivocarse o los datos puede corromperse. Sin embargo, si queremos hacer predicciones o usar los datos de manera eficiente, debemos de procurar que la información en nuestro DataSet no nos produzca errores.
Es aquí donde entra el concepto de Data Cleaning, que se encarga de arreglar o eliminar datos 'erróneos'. ¿Cuales serían estos datos erróneos en los Datasets?
Entre estos podemos encontrar:
- Celdas con valores nulos.
- Celdas con el formato incorrecto.
- Celdas con valores inapropiados.
- Celdas duplicados.
Una celda es simplemente el dato que se encuentra en una columna para una fila particular. Por ejemplo, para el dataset de los videojuegos, la palabra Wii dentro de la columna Platform en el índice 0 sería una celda.
Ahora, veamos como podemos arreglar cada tipo de dato erróneo.
Arreglando celdas con valores nulos
Shoutout to GeeksforGeeks
Un valor nulo es lo que aparece cuando por alguna razón, no se introduce información alguna en una celda, mostrándonos un NaN cuando intentamos verla:
Existen dos formas de solucionar este problema:
- Eliminar la fila con la celda nula.
- Reemplazar el valor de la celda vacía por un valor que la columna acepte.
Por ejemplo, si tuvieramos el DataFrame Professors.csv, con el que tendremos las asignaturas, fechas, salón y nombre de profesor:
  Assignment            Day  Classroom       Professor
0     'Math'   '2023/10/11'     'A-01'   'Mr Robinson'
1  'English'   '2023/10/12'     'A-02'      'Mrs Gray'
2  'Spanish'            NaN     'A-03'    'Mr. Stefan'
Si quisieramos eliminar la última fila, deberíamos de hacer uso de dropna(), un método que nos permite eliminar todas las filas que tengan valores nulos:
import pandas as pd

df_prof = pd.read_csv('Professors.csv')
new_prof = df_prof.dropna()

print(new_prof)

>>>
  Assignment            Day  Classroom       Professor
0     'Math'   '2023/10/11'     'A-01'   'Mr Robinson'
1  'English'   '2023/10/12'     'A-02'      'Mrs Gray'
Sin embargo, esto tiene el inconveniente de que una vez que eliminemos la fila, tendremos que crear otro DataFrame con los nuevos valores, dejando el primer DataFrame intacto. Si queremos eliminar las filas, modificando el DataFrame original, tendremos que usar el parámetro inplace = True dentro del dropna():
import pandas as pd

df_prof = pd.read_csv('Professors.csv')
df_prof.dropna(inplace = True)

print(df_prof)

>>>
  Assignment            Day  Classroom       Professor
0     'Math'   '2023/10/11'     'A-01'   'Mr Robinson'
1  'English'   '2023/10/12'     'A-02'      'Mrs Gray'
La otra forma en la que podemos manejar la situación de filas vacías es reemplazar estas por un valor actual. Esto lo hacemos con fillna, que nos permitirá ingresar un valor por defecto como argumento posicional para aquellas filas que no tengan valor alguno.
import pandas as pd

df_prof = pd.read_csv('Professors.csv')
df_prof.fillna('Undefined', inplace = True)

print(df_prof)

>>>
  Assignment            Day  Classroom       Professor
0     'Math'   '2023/10/11'     'A-01'   'Mr Robinson'
1  'English'   '2023/10/12'     'A-02'      'Mrs Gray'
2  'Spanish'      Undefined     'A-03'    'Mr. Stefan'
Además, podemos escoger reemplazar solo los valores nulos para una columna que escojamos usando el nombre de esta. Por ejemplo, si aplicaramos el siguiente código:
df_prof['Day'].fillna('Undefined', inplace = True)
Entonces, se reemplazarán solo los valores NaN de la columna Day. Si tuvieramos una celda en la columna Professor vacía, esta seguirá vacía.
Arreglando celdas con formatos distintos
Shoutout to GeeksforGeeks
Si el caso es que una de las celdas tenga un valor que no concuerda con el DataType de la columna, podremos cambiarlo de la siguiente forma:
Si tomamos el dataset anterior y le agregamos una columna que tenga el nombre de alumnos, veremos lo siguiente:
  Assignment            Day  Classroom       Professor  Students
0     'Math'   '2023/10/11'     'A-01'   'Mr Robinson'        30
1  'English'   '2023/10/12'     'A-02'      'Mrs Gray'      "36"
2  'Spanish'            NaN     'A-03'    'Mr. Stefan'        24
Aquí veremos que la segunda fila no coincide con los DataTypes anteriores, los cuales son de tipo int, mientras que esta es una string. Si queremos convertir esta celda a un valor entero, tendremos que usar el método astype de pandas, con el que solo tendremos que introducir el tipo de valor como parámetro:
df_prof['Students'] = df_prof['Students'].astype(int)

print(df_prof.Students)
>>>
  Assignment           Day Classroom      Professor Students
0     'Math'  '2023/10/11'    'A-01'  'Mr Robinson'       30
1  'English'  '2023/10/12'    'A-02'     'Mrs Gray'       36
2  'Spanish'           NaN    'A-03'   'Mr. Stefan'       24
Con lo que tendremos ahora todos los valores de la columna Students como int.
Arreglando celdas con valores incorrectos
Shoutout to Sharp Sight
Habrán casos donde no se podrán convertir los DataTypes de una celda para que coincidan con los de la columna o se coloque un valor muy por encima o muy por debajo del rango común. Por ejemplo:
  Assignment           Day Classroom      Professor Students
0     'Math'  '2023/10/11'    'A-01'  'Mr Robinson'       30
1  'English'  '2023/10/12'    'A-02'     'Mrs Gray'   sdasag
2  'Spanish'           NaN    'A-03'   'Mr. Stefan'       24
Para este caso, podemos seleccionar el valor específico y reemplazarlo con replace:
import pandas as pd

df_prof = pd.read_csv('Professors.csv')
df_prof.replace('sdasag', 20, inplace=True)

print(df_prof)

>>>
  Assignment           Day Classroom      Professor Students
0     'Math'  '2023/10/11'    'A-01'  'Mr Robinson'       30
1  'English'  '2023/10/12'    'A-02'     'Mrs Gray'       20
2  'Spanish'           NaN    'A-03'   'Mr. Stefan'       24
Además de esto, para valores numéricos fuera de rango, podemos establecer condiciones. Por ejemplo, para los siguientes valores:
  Assignment           Day Classroom      Professor  Students
0     'Math'  '2023/10/11'    'A-01'  'Mr Robinson'        30
1  'English'  '2023/10/12'    'A-02'     'Mrs Gray'        60
2  'Spanish'           NaN    'A-03'   'Mr. Stefan'        24
Si queremos que los valores no superen los 40 estudiantes, entonces solo tenemos que hacer uso del ciclo for y los condicionales con loc[]:
import pandas as pd

df_prof = pd.read_csv('Professors.csv')

for index in df_prof.index:
    if df_prof.loc[index, 'Students'] > 40:
        df_prof.loc[index, 'Students'] = 40

print(df_prof)
Aquí vemos que usamos el método .index para obtener la cantidad de índices que hay en el DataFrame y usamos loc para encontrar el elemento específico tanto en fila como columna. Verificamos si es mayor que 40, y si lo es, lo preestablecemos como este valor:
  Assignment           Day Classroom      Professor  Students
0     'Math'  '2023/10/11'    'A-01'  'Mr Robinson'        30
1  'English'  '2023/10/12'    'A-02'     'Mrs Gray'        40
2  'Spanish'           NaN    'A-03'   'Mr. Stefan'        24
Y si queremos borrar, solo tenemos que usar drop, siguiendo los mismos preceptos de dropna:
import pandas as pd

df_prof = pd.read_csv('Professors.csv')

for index in df_prof.index:
    if df.loc[index, "Students"] > 40:
        df_prof.drop(index, inplace=True)

print(df_prof)

>>>
  Assignment           Day Classroom      Professor  Students
0     'Math'  '2023/10/11'    'A-01'  'Mr Robinson'        30
1  'Spanish'           NaN    'A-03'   'Mr. Stefan'        24
Arreglando Filas Duplicadas
Shoutout to GeekPython
Otra de los inconvenientes que debemos de arreglar son las filas duplicadas, que pueden producirse por algún error durante el proceso de escritura y que eliminamos para evitar la redundancia en los datos.
Lo primero que deberíamos de hacer es identificar si existe una fila duplicada. Esto lo podemos hacer con el método .duplicated(), que hará justo esto. Si tenemos el siguiente DataFrame:
  Assignment           Day Classroom      Professor  Students
0     'Math'  '2023/10/11'    'A-01'  'Mr Robinson'        30
1  'English'  '2023/10/12'    'A-02'     'Mrs Gray'        60
2  'English'  '2023/10/12'    'A-02'     'Mrs Gray'        60
Y usando duplicated, nos dará False si la fila no está duplicada con respecto a la anterior, haciendo lo contrario si está duplicada:
df_prof.duplicated()

>>>
0    False
1    False
2     True
dtype: bool
Ahora que se sabe que hay una duplicada, solo tendremos que usar el método drop_duplicates para eliminar los duplicados:
df_prof = pd.read_csv('Professors.csv')
df_prof.drop_duplicates(inplace=True)

print(df_prof)

>>>
  Assignment           Day Classroom      Professor  Students
0     'Math'  '2023/10/11'    'A-01'  'Mr Robinson'        30
1  'English'  '2023/10/12'    'A-02'     'Mrs Gray'        60
Y de esta forma, tendremos un DataFrame libre de duplicados.
Como ves, el mantener los datos ordenados, 'limpios' y libres de errores son una de las prioridades para los científicos de datos, quienes trabajarán con enormes cantidades de información y pueden obtener un sin número de errores de no cumplirse.
Espero que el siguiente artículo te haya proveído de las herramientas necesarias para leer y limpiar datos, lo que te llevará a ser mucho más eficiente en tu trabajo al analizar datos.
¡Los veo en el siguiente episodio de Coding Basics!
Thanks for your contribution to the STEMsocial community. Feel free to join us on discord to get to know the rest of us!
Please consider delegating to the @stemsocial account (85% of the curation rewards are returned).
You may also include @stemsocial as a beneficiary of the rewards of this post to get a stronger support.