Pandas #1: Understanding Panda / Pandas #1: Entendiendo Panda - Coding Basics
The power of Pandas

Shoutout to Real Python

In this article you will find:
- Introduction
- What is Pandas?
- How do you use Pandas?
- Series
- DataFrames
Greetings to all!
I know I promised I was going to continue with NumPy. However, I realized things:
- With respect to concepts that we can all understand, there were only two random applications left: One being adding probabilities to random.choice (for that it uses the parameter p) and being able to change the order of the elements within an array with permutate and shuffle .
- If we wanted to understand the ultimate potential of NumPy, we had to delve into the depths of statistics, which would require another article.
Don't worry though, that's for now. We will soon revisit NumPy to test our new knowledge.
The good side is that now we are delving into the use of libraries that are of great application and that can be used for a large number of things such as data analysis, data scraping, artificial intelligence and many more invaluable skills in the field. modern day.
Among these, one of the most popular is Pandas, a library that will allow us to work with immense amounts of data and make predictions based on them through statistical models.
While this may sound intimidating, I'll make sure to keep it as simple as possible, so you have a firm understanding of this library. That being said, it's time!
Without more to say,
What is Pandas?

Shoutout to w3resource
In essence Pandas is a Python library that is used to read and manipulate Data Sets. But what is a Data Set?
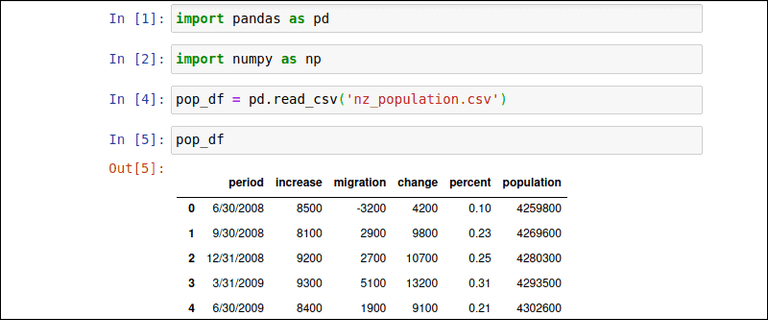
A Data Set is a table that contains data from different columns, referring to different attributes within a database, as can be seen in the following image:
Now, why use Data Sets?
There are a large number of reasons, with the main ones being that when working with prediction models such as machine learning or inferential algorithms, we must have organized data to make predictions.
If, for example, we have a table where the temperature value every day is between 30 and 32 degrees Celsius, we can predict that tomorrow the temperature will be in this range.
Additionally, many times these boards may have minor defects that we may not be aware of. Sometimes some rows have null values where this is not allowed and we must delete them. To do this efficiently and quickly, Pandas is used.
Among some of the things we can do with Pandas, we have:
- Load and Save Data.
- Change the shape of tables and information.
- Graph the values we obtain.
And many more. Enough with the sales monologue, though. It's time to see how Pandas is used.
How do you use Pandas?
Shoutout to phoenixNAP
Before using Pandas, we must install it. For this, we use pip on our command line and use pip install:
C:\YourPc>>> pip install pandas
In addition to this, you can use Python distributions that already have Pandas included such as Anaconda, miniconda and Spyder.
Once we have pandas installed, it is time to import into our program:
import pandas
Now, to see one of its most popular functions, DataFrame, which allows us to see the DataSet in an organized manner in tables and columns, we must create the Data Set first.
To do this, we create a dictionary with the values of the first column (the identifiers) as key and the rest of the rows as values in a list:
For example, if we want to create a DataSet for the richest people in the world:
import pandas

networth = {
'name': ['Elon Musk', 'Bernard Arnault', 'Jeff Bezos', 'Larry Ellison', 'Warren Buffett'],
'net worth': ['260B', '190B', '151B', '141B', '116B']
}
Now, we just need to create a variable to store the DataFrame object that will be created when we run pandas.DataFrame and print:
richest = pandas.DataFrame(networth)
print(richest)
When running:
               name net worth
0 Elon Musk 260B
1 Bernard Arnault 190B
2 Jeff Bezos 151B
3 Larry Ellison 141B
4 Warren Buffett 116B
This is a DataFrame. However, before understanding this concept we must know what a series is.
Series
Shoutout to LearnDataSci
If you remember what you learned in previous editions, you will know what a first-dimensional array is, that is, an array whose elements will be zero-dimensional arrays or simply elements. For example:
a = [1,2,3,4]
This list would be a first-dimensional arrangement. Now, this is basically what a series is, a first-dimensional arrangement, which when interpreted in the context of a dataset, seeing as the range of values that can be presented in a column. If a column called days has 7 days, then we would have to create a list with 7 values and then use the pandas method that allows us to create these series:
days = [1,2,3,4,5,6,7]

newSeries = pandas.Series(days)

print(newSeries)
And if we execute:
0 1
1 2
23
3. 4
Four. Five
5 6
6 7
dtype: int64
Here we can notice two important things:
- That the values are represented as two columns, where those in our list belong to the second.
- The first row identifies the indices of each value.
If we want to change this and place our own indices on the entered values, we only have to use the index parameter, where:
import pandas

days = [1,2,3,4,5,6,7]

newSeries = pandas.Series(days, index = ['day1','day2','day3','day4','day5','day6','day7'])

print(newSeries)
And when executing:
day1 1
day2 2
day3 3
day4 4
day5 5
day6 6
day7 7
dtype: int64
Additionally, we can avoid having to write the indexes separately to the series by simply placing it as a key/value pair, that is, a dictionary. This is done as follows:
day_values = {'day1': 1,'day2': 2,'day3': 3,'day4': 4,'day5': 5,'day6': 6,'day7': 7}

new_series = pandas.Series(day_values)

print(day_values)
And when executing:
day1 1
day2 2
day3 3
day4 4
day5 5
day6 6
day7 7
dtype: int64
Which could be done in the same way. This can even be beneficial for hiding certain values. If we only want to show some days, not all, we just have to indicate them with index again:
day_values = {'day1': 1,'day2': 2,'day3': 3,'day4': 4,'day5': 5,'day6': 6,'day7': 7}

new_series = pandas.Series(day_values, index=['day1','day2','day3'])

print(day_values)
And when executing:
day1 1
day2 2
day3 3
dtype: int64
DataFrames
Shoutout to Shane Lynn
DataFrames are two-dimensional arrays, that is, whose elements are first-dimensional arrays. A list of lists is a two-dimensional array, which can be considered as a matrix or, in the case of DataFrames, as a table with rows and columns.
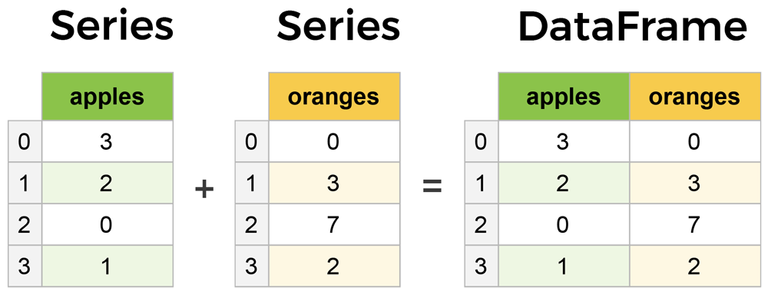
If we compare the concept of the DataFrame with that of series, we can immediately see that what makes up a DataFrame are series.
To create a DataFrame, as we saw previously, we only have to create the information as a dictionary, where the keys will represent the first row and the values will be all the columns corresponding to their values. It is for this reason that values are usually placed in the form of lists, since they will represent a large number of series.
If we wanted to create a table that contains the number of shoe models for a specific table.
import pandas

shoes = {
   "size": ['10', '10.5', '11', '12'],
   "model_amount": [5, 15, 20, 30]
}

df_shoes = pd.DataFrame(shoes)

print(df_shoes)

>>>
    size model_amount
0 10 5
1 10.5 15
2 11 20
3 12 30
Another advantage that dataframes provide us is that we can take values from specific rows and work with them. The only thing we have to use is a Pandas method called loc, which will return this information to us as an object. If we use it to get the first column:
print(df_shoes.loc[0])

>>>
size 10
model_amount 5
Name: 0, dtype: object
If we want to return more than one row, we just transform the loc index into a two-dimensional array and do it:
print(df_shoes.loc[[0,1]])

>>>
size model_amount
0 10 5
1 10.5 15
Now, we can also use the index parameter in the dataframes to determine the name of the indexes:
import pandas

shoes = {
   "size": ['10', '10.5', '11', '12'],
   "model_amount": [5, 15, 20, 30]
}

df_shoes = pandas.DataFrame(shoes, index = ['Nikes', 'Adidas', 'Pumas', 'New Balance'])

print(df_shoes)

>>> size model_amount
Nikes 10 5
Adidas 10.5 15
Cougars 11 20
New Balance 12 30
And based on this, we can use loc to grab a row if we indicate the index name or value:
print(df_shoes.loc['Nikes'])

>>>
size 10
model_amount 5
Name: Nikes, dtype: object
As a last point, we have something that will be of great help to us when we work with a large number of programs that require data analysis and attribute collections for artificial intelligence, it will be learning to load Data Sets from external sources into our Data Frames.
To do this, we must first download a Data Set. There are a large number of pages with Data Sets that are used in databases for video games, image recognition and many other programs. One of these sites is Stats NZ, where we can obtain information about New Zealand in the form of Data Sets.
In this case, we will use a Data Set for electronic card transactions in July 2023. If you want to download any of these, [this is the site](https://www.stats.govt.nz/large-datasets/csv -files-for-download/):
import pandas

dataframe_cards = pandas.read_csv('electronic-card-transactions-july-2023-csv-tables.csv')

print(dataframe_cards)

>>>
       Series_reference Period ... Series_title_4 Series_title_5
0 ECTA.S19A1 2001.03 ... NaN NaN
1 ECTA.S19A1 2002.03 ... NaN NaN
2 ECTA.S19A1 2003.03 ... NaN NaN
3 ECTA.S19A1 2004.03 ... NaN NaN
4 ECTA.S19A1 2005.03 ... NaN NaN
... ... ... ... ... ...
19740 ECTQ.S4AXP 2022.06 ... NaN NaN
19741 ECTQ.S4AXP 2022.09 ... NaN NaN
19742 ECTQ.S4AXP 2022.12 ... NaN NaN
19743 ECTQ.S4AXP 2023.03 ... NaN NaN
19744 ECTQ.S4AXP 2023.06 ... NaN NaN

[19745 rows x 14 columns]
As we can see, we only had to use read_csv and indicate the address and name of the file as a parameter. In this case, since the file was in the same folder we only had to enter the name. Likewise, we must remember to place the extension at the end.
Then, when printing, we can see a giant DataFrame, which we can see has 19745 entries in its rows and 14 attributes that are followed.
After reading this article, you will already be introduced to Pandas and its basic concepts: DataFrames and Series. In addition, you already know how to enter information from external media to work more comfortably.
In this way, a new stage begins where we will begin to see the true beauty of Python libraries and how many beautiful projects we can create with them. If you want to know how to use Pandas in depth, stay tuned for the next Coding Basics.
Until then!

El poder de Pandas
Shoutout to Real Python
En este artículo encontrarás:
- Introducción
- ¿Qué es Pandas?
- ¿Cómo se usa Pandas?
- Series
- DataFrames
¡Un saludo a todos!
Sé que prometí que iba a continuar con NumPy. Sin embargo, me di cuenta de cosas:
- Con respecto a conceptos que todos podemos entender, solo quedaban dos aplicaciones random: Una siendo el agregar probabilidades a random.choice (Para eso usa el parámetro p) y el poder cambiar el orden de los elementos dentro de un arreglo con permutate y shuffle.
- Si queríamos comprender el potencial final de NumPy, debíamos de adentrarnos en lo profundo de la estadística, cosa que requeriría otro artículo.
Sin embargo, no te preocupes, eso será por ahora. Dentro de poco volveremos a visitar NumPy en orden probar nuestros nuevos conocimientos.
El lado bueno, es que ahora nos adentramos en el uso de librerías que son de gran aplicación y que nos pueden servir para gran cantidad de cosas como lo son el análisis de datos, el data scraping, inteligencia artificial y muchas más habilidades invaluales en el día moderno.
Entre estas, una de las más populares es Pandas, una librería que nos permitirá trabajar con cantidades inmensas de datos y hacer predicciones en base a estas por medio de modelos estadísticos.
Mientras que esto puede sonar intimidante, me aseguraré de hacerlo lo más sencillo, para que tengas un firme entendimiento de esta librería. Dicho esto, ¡Es el momento!
Sin más que decir,
¿Qué es Pandas?
Shoutout to w3resource
En esencia Pandas es una librería de Python que se emplea para leer y manipular Data Sets. Pero ¿Qué es un Data Set?
Un Data Set es una tabla que contiene los datos de diferentes columnas, refiriéndose a distintos atributos dentro de una base de datos, como se puede observar en la siguiente imagen:
Ahora bien, ¿Para qué usar Data Sets?
Existen una gran cantidad de motivos, con los principales siendo que al trabajar con modelos de predicción como lo son machine learning o algoritmos inferenciales, debemos de tener datos ordenados para realizar predicciones.
Si por ejemplo, tenemos un tabla donde el valor de temperatura en todos los días se encuentra entre 30 y 32 grados celsius, se podrá predecir que mañana la temperatura se encontrará en este rango.
Además, muchas veces estas tablas pueden tener defectos menores de los que no podemos darnos cuenta. A veces algunas filas tienen valores nulos donde esto no está permitido y debemos de borrarlas. Para realizar esto de manera eficiente y rápida, se usa Pandas.
Entre algunas de las cosas que podemos hacer con Pandas, tenemos:
- Cargar y Guardar Datos.
- Cambiar la forma de las tablas y la información.
- Graficar los valores que obtengamos.
Y muchas más. Sin embargo, suficiente con el monólogo de ventas. Es tiempo de ver como se usa Pandas.
¿Cómo se usa Pandas?
Shoutout to phoenixNAP
Antes de usar Pandas, debemos de instalarlo. Para esto, usamos pip en nuestra línea de comandos y empleamos el pip install:
C:\YourPc>>> pip install pandas
Además de esto, puedes hacer uso de distribuciones de Python que ya tienen Pandas incluido como lo son Anaconda, miniconda y Spyder.
Una vez que tenemos pandas instalado, es tiempo de hacer import en nuestro programa:
import pandas
Ahora, para ver una de sus funciones más populares, DataFrame, que nos permite ver el DataSet de manera ordenada en tablas y columnas, debemos de crear el Data Set primero.
Para esto, creamos un diccionario con los valores de la primera columna (los identificadores) como clave y como valores en una lista el resto de filas:
Por ejemplo, si queremos crear un DataSet para las personas más ricas del mundo:
import pandas

networth = {
    'name': ['Elon Musk', 'Bernard Arnault', 'Jeff Bezos', 'Larry Ellison', 'Warren Buffett'],
    'net worth': ['260B', '190B', '151B', '141B', '116B']
}
Ahora, solo tenemos que crear una variable para almacenar el objeto DataFrame que se creará cuando ejecutemos pandas.DataFrame e imprimir:
richest = pandas.DataFrame(networth)
print(richest)
Al ejecutar:
              name net worth
0        Elon Musk      260B
1  Bernard Arnault      190B
2       Jeff Bezos      151B
3    Larry Ellison      141B
4   Warren Buffett      116B
Esto es un DataFrame. Sin embargo, antes de comprender este concepto debemos de saber lo que es una serie.
Serie
Shoutout to LearnDataSci
Si recuerdas lo aprendido en las ediciones anteriores, sabrás lo que es un arreglo de primera dimensión, es decir, un arreglo cuyos elementos serán arreglos de dimensión cero o simplemente elementos. Por ejemplo:
a = [1,2,3,4]
Esta lista vendría siendo un arreglo de primera dimensión. Ahora bien, esto es basicamente lo que es una serie, un arreglo de primera dimensión, que al ser interpretado en el contexto de un dataset, viendo siendo el rango de valores que se pueden presentar en una columna. Si una columna llamada days, tiene 7 días, entonces tendríamos que crear una lista con 7 valores y luego usar el método de pandas que nos permite crear estas series:
days = [1,2,3,4,5,6,7]

newSeries = pandas.Series(days)

print(newSeries)
Y si ejecutamos:
0    1
1    2
2    3
3    4
4    5
5    6
6    7
dtype: int64
Aquí podemos notar dos cosas importantes:
- Que los valores se representan como dos columnas, donde los de nuestra lista pertenecen a la segunda.
- La primera fila nos identifica los índices de cada valor.
Si queremos cambiar esto y colocarle nuestros propios índices a los valores introducidos, solo debemos hacer uso del parámetro index, donde:
import pandas

days = [1,2,3,4,5,6,7]

newSeries = pandas.Series(days, index = ['day1','day2','day3','day4','day5','day6','day7'])

print(newSeries)
Y al ejecutar:
day1    1
day2    2
day3    3
day4    4
day5    5
day6    6
day7    7
dtype: int64
Además, podemos evitar tener que escribir los índices por separado a la serie con tan solo colocarlo como un par clave/valor, es decir un diccionario. Esto se realiza de la siguiente manera:
day_values = {'day1': 1,'day2': 2,'day3': 3,'day4': 4,'day5': 5,'day6': 6,'day7': 7}

new_series = pandas.Series(day_values)

print(day_values)
Y al ejecutar:
day1    1
day2    2
day3    3
day4    4
day5    5
day6    6
day7    7
dtype: int64
Que se podría realizar de la misma forma. Esto puede ser beneficioso incluso para ocultar ciertos valores. Si solo queremos mostrar algunos días, no todos, solo debemos de indicarlos con index de nuevo:
day_values = {'day1': 1,'day2': 2,'day3': 3,'day4': 4,'day5': 5,'day6': 6,'day7': 7}

new_series = pandas.Series(day_values, index=['day1','day2','day3'])

print(day_values)
Y al ejecutar:
day1    1
day2    2
day3    3
dtype: int64
DataFrames
Shoutout to Shane Lynn
Los DataFrames son arreglos de dos dimensiones, es decir, cuyos elementos son arreglos de primera dimensión. Una lista de listas es un arreglo de dos dimensiones, que se puede considerar como una matriz o, en el caso de los DataFrames como una tabla con filas y columnas.
Si comparamos el concepto del DataFrame con el de las series, podemos ver de inmediato que lo que compone un DataFrame son series.
Para crear un DataFrame, como vimos anteriormente, solo debemos de crear la información como un diccionario, donde las claves representarán la primera fila y los valores serán todas las columnas correspondientes a los valores de estas. Es por esta razón que los valores suelen colocarse en forma de listas, ya que representarán una gran cantidad de series.
Si quisieramos crear una tabla que contenga la cantidad de modelos de zapatos para una tabla específica.
import pandas

shoes = {
  "size": ['10', '10.5', '11', '12'],
  "model_amount": [5, 15, 20, 30]
}

df_shoes = pd.DataFrame(shoes)

print(df_shoes)

>>>
   size  model_amount
0    10             5
1  10.5            15
2    11            20
3    12            30
Otra de las ventajas que nos proporcionan los dataframes es que podemos tomar valores de filas específicas y trabajar con estos. Lo único que debemos usar es un método de pandas llamado loc, el cual nos devolverá como un objeto esta información. Si lo usamos para obtener la primera columna:
print(df_shoes.loc[0])

>>>
size            10
model_amount     5
Name: 0, dtype: object
Si queremos retornar más de una fila, solo transformamos el índice de loc en un arreglo de dos dimensiones y lo hacemos:
print(df_shoes.loc[[0,1]])

>>>
size  model_amount
0    10             5
1  10.5            15
Ahora bien, también podemos usar el parámetro index en los dataframes para determinar el nombre de los índices:
import pandas

shoes = {
  "size": ['10', '10.5', '11', '12'],
  "model_amount": [5, 15, 20, 30]
}

df_shoes = pandas.DataFrame(shoes, index = ['Nikes', 'Adidas', 'Pumas', 'New Balance'])

print(df_shoes)

>>>              size  model_amount
Nikes          10             5
Adidas       10.5            15
Pumas          11            20
New Balance    12            30
Y basado en esto, podemos usar loc para tomar una fila si indicamos el nombre o valor del índice:
print(df_shoes.loc['Nikes'])

>>>
size            10
model_amount     5
Name: Nikes, dtype: object
Como último punto, tenemos algo que nos será de gran ayuda cuando trabajemos con gran cantidad de programas que requieran del análisis de datos y colecciones de atributos para inteligencia artificial será el aprender a cargar Data Sets de fuentes externas dentro de nuestros Data Frames.
Para llevar esto a cabo, primero debemos de descargar un Data Set. Existe una gran cantidad de páginas con Data Sets que son usados en bases de datos para videojuegos, reconocimiento de imágenes y muchos otros programas. Uno de estos sitios es Stats NZ, donde podemos obtener información sobre Nueva Zelanda en forma de Data Sets.
En este caso, usaremos un Data Set para las transacciones con tarjetas electrónicas en Julio de 2023. Si quieres descargar alguno de estos, este es el sitio:
import pandas

dataframe_cards = pandas.read_csv('electronic-card-transactions-july-2023-csv-tables.csv')

print(dataframe_cards)

>>>
      Series_reference   Period  ...  Series_title_4 Series_title_5
0           ECTA.S19A1  2001.03  ...             NaN            NaN
1           ECTA.S19A1  2002.03  ...             NaN            NaN
2           ECTA.S19A1  2003.03  ...             NaN            NaN
3           ECTA.S19A1  2004.03  ...             NaN            NaN
4           ECTA.S19A1  2005.03  ...             NaN            NaN
...                ...      ...  ...             ...            ...
19740       ECTQ.S4AXP  2022.06  ...             NaN            NaN
19741       ECTQ.S4AXP  2022.09  ...             NaN            NaN
19742       ECTQ.S4AXP  2022.12  ...             NaN            NaN
19743       ECTQ.S4AXP  2023.03  ...             NaN            NaN
19744       ECTQ.S4AXP  2023.06  ...             NaN            NaN

[19745 rows x 14 columns]
Como podemos observar, solo tuvimos que usar read_csv e indicar la dirección y nombre del archivo como parámetro. En este caso, ya que el archivo se encontraba en la misma carpeta solo tuvimos que colocar el nombre. De igual manera, debemos recordar colocar la extensión al final.
Luego, al imprimir, podemos ver un DataFrame gigante, el cual podemos evidenciar que tiene 19745 entradas por sus filas y 14 atributos que se siguen.
Tras leer este artículo, ya estarás introducido en Pandas y sus conceptos básicos: Los DataFrames y las Series. Además, ya sabes como introducir información de medios externos para trabajar con mayor comodidad.
De esta forma, comienza una nueva etapa donde comenzaremos a ver la verdadera belleza de las librerías de Python y cuantos hermosos proyectos podemos crear con estas. Si quieres saber como se usa Pandas en profundidad, sigue atento al próximo Coding Basics.
¡Hasta entonces!
Thanks for your contribution to the STEMsocial community. Feel free to join us on discord to get to know the rest of us!
Please consider delegating to the @stemsocial account (85% of the curation rewards are returned).
You may also include @stemsocial as a beneficiary of the rewards of this post to get a stronger support.
Congratulations @jesalmofficial! You have completed the following achievement on the Hive blockchain And have been rewarded with New badge(s)
You can view your badges on your board and compare yourself to others in the Ranking
If you no longer want to receive notifications, reply to this comment with the word
STOPCheck out our last posts: