ANALYSING, IDENTIFYING AND SEPARATING SUBSTANCES II
Hello, dear readers. I will be starting today's post on the explanation of a special type of spectrometer called The Time-of-flight mass spectrometer.
TIME-OF-FLIGHT MASS SPECTROMETER
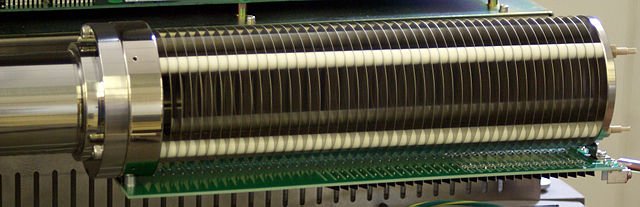
It was during the 1950s that time-of-flight mass spectrometers (TOF-MS) were first developed. The principle is simpler than the single beam mass spectrometer that was explained in the previous post. To separate ions according to their masses and charges, instead of deflecting ions in a known magnetic field, the ions are simply all accelerated together by a pulsed electric field. A voltage is applied across the accelerator plates, which creates a burst of ions all with the same kinetic energy. These are released at the same time into a region of the mass spectrometer where there are no fields, so they are allowed to drift.
Since kinetic energy = ½ mv2 (m = mass of ion and v = velocity (speed) of ion), the speed of each ion from the accelerating electric field to the detector depends on its mass. It also depends on its charge, since the greater the charge on an ion the more it is accelerated. This means that the time taken to reach the detector will be different for ions of different mass/charge ratios. As with the single beam mass spectrometer, most of the ions produced are singly charged, so the peaks of the mass spectrum show the relative masses.
Although TOF-MS was developed more than 50 years ago, it is more recently that accurate timing of the ions in the drift region was developed, since ions complete the path to the detector in times of less than a nanosecond. This type of mass spectrometer can now be made much smaller than the single-beam instrument and there are portable versions in many research labs around the world.
FINDING RELATIVE ATOMIC MASSES USING A MASS SPECTROMETER
Relative atomic masses can be worked out very accurately using a mass spectrometer. (This was one of the first uses for the instrument.) Take neon, for example, whose mass spectrum is shown in the figure below. To calculate its Ar, we follow this procedure:
Ar(neon) = [(90.92 × 20) + (0.26 × 21) + (8.82 × 22)] ÷ 100 = 2018 ÷ 100 = 20.18.
Germanium has five naturally occurring isotopes and its relative atomic mass can be calculated in the same way.
FINDING RELATIVE MOLECULAR MASSES AND MOLECULAR FORMULAE
The mass spectrometer is more commonly used to find relative molecular masses. When a compound such as butane, C4H10, is analysed, its mass spectrum shows a whole series of peaks. The peak with the highest mass is the molecular ion, M+. It is the molecule with one electron removed. A simple calculation of Mr tells you to expect the molecular ion to have its peak at 58. This peak results from those molecules of butane that contain an atom of carbon-13 (13C). Known as the M+1 peak, it is always smaller than the molecular-ion peak because there are far fewer naturally occurring carbon-13 atoms. However, as shown later, the M+1 peak can help you to work out the number of carbon atoms in the molecule.
The other peaks in the mass spectrum are caused by butane molecular ions that have broken into fragments. This fragmentation is important in working out the identity of molecules.
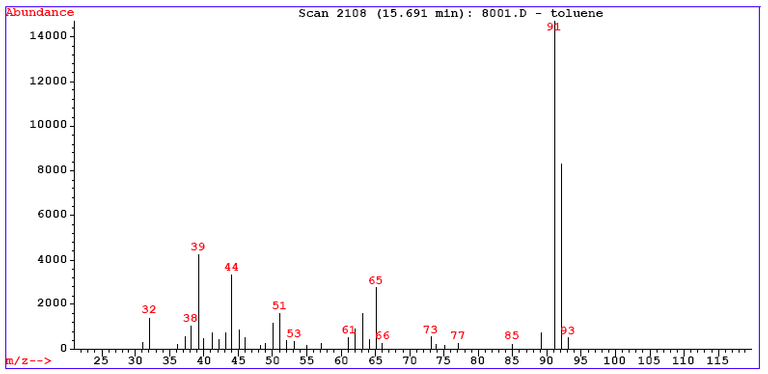
The mass spectrum for toluene has around 30 peaks. wikipedia, CC BY-SA 3.0
High-resolution mass spectrometry
The mass spectrum above is from a spectrometer set for low resolution. At higher resolutions, it may be possible to deduce the molecular formula. We know that butane has an approximate Mr of 58, but C4H10 is not the only possible molecular formula for this value of Mr: all the molecules shown in the table below have an approximate Mr of 58. However, very accurate values for Mr can be obtained using high-resolution mass spectrometry. So it is possible to determine which compound is present if accurate values for relative isotopic masses are used.
Relative isotopic masses: 12C = 12.0000; 1H = 1.0078; 14N = 14.0031; 16O = 15.9949
| Formulae | Accurate Mr (m/e values for M+ ion) |
| C4H10 | 58.0780 |
| C3H8O | 58.0417 |
| C2H2O2 | 58.0054 |
| C2H6N2 | 58.0530 |
USING FRAGMENTATION TO DETERMINE STRUCTURE
The mass spectrum of butane has several peaks because of the way that the butane molecular ion fragments in the mass spectrometer. These fragments can be used to identify parts of the molecule and, in many cases, build up a picture of the structure of the whole molecule. Apart from deciding the identity of the peaks, the other important thing to look for is the differences in masses between the peaks. A difference of 15 almost certainly shows the loss of a methyl fragment, and so it is highly likely that the original molecule contains a CH3 group. A different of 77 indicate the loss of a phenyl group (C6H5+).
When a molecular ion fragments, the chemistry becomes rather complicated, and so we discuss only a small part of it here. In a situation whereby, the molecular-ion peak (M) is 58. The loss of a methyl fragment produces the peak at 43. The butane molecular ion has fragmented to give C3H7+ and a free radical CH3•, which is neutral and so is not affected by the electric and magnetic fields of the mass spectrometer.
C4H10+ → C3H7+ + CH3•
There are other characteristic differences in the masses between peaks that give clues to which other groups have been lost as free radicals. For example, a loss of 17 suggests that an OH group may have been removed, and a loss of 29 suggests a C2H5 group.
Looking at the spectrum of ethanol, CH3CH2OH, the molecular-ion peak is 46, which corresponds to CH3CH2OH+. The base peak is at 31. The difference betwcen 46 and 31 is 15, so it is probable that a CH3 group has been lost. Therefore, the ion responsible for the base peak is CH2OH+. The peak at 29 is from CH3CH2+, and that at 15 is CH3+. Notice that there is an M+1 peak at 47 because of the isotope carbon-13.
In the next section, I will show how this peak can be used to determine the number of carbon atoms present in the molecule.
ISOTOPE PEAKS
The presence of isotopes in a compound will give characteristic peaks. We met one of these peaks when we examined butane and ethanol. The M+1 peak resulted from the isotope carbon-13. Carbon-13 is present naturally as 1.1 per cent of all carbon atoms, information that allows us to work out the number of carbon atoms in a molecule. If there were one carbon atom in a molecule, the M+1 peak height would be 1.1 per cent of the molecular-ion peak, because 1.1 per cent of molecules would contain carbon-13. So in a molecule that contains five carbon atoms, about 5.5 per cent will be carbon-13. That is, the M+1 peak height will be about 5.5 per cent of the M peak height.
[M+2] and [M+4] peaks
Chlorine and bromine atoms also give characteristic peaks because of their isotopic compositions. In the case of chlorine, 75 per cent is 35CI and 25 per cent is 37CI. This means that when a molecule contains a chlorine atom, there are two peaks at M and M+2 in the ratio of 75:25, or 3:1. Although I refer to these peaks as M and M+2, they both are molecular ions. Similarly M+2 and M+4 peaks arise if there are two chlorine atoms or two bromine atoms in a molecule.
INFRARED SPECTROSCOPY
Atoms in molecules vibrate about their covalent bonds. These vibrations have definite (quantised) energy levels, in the same way that electrons have quantised energy levels in atoms. To increase the vibration in a molecule from one level to the next, a definite amount of energy must be absorbed. These amounts of energy correspond to radiation in the infrared part of the electromagnetic spectrum.
For infrared radiation to be absorbed, the vibrations must cause a change in the dipole moment of the molecule. Therefore, the symmetrical bonds in N2 and O2 do not absorb infrared radiation. This is why N2 and O2 are not greenhouse gases – they cannot absorb the infrared radiation emitted by the Earth. However, we know that carbon dioxide is an important greenhouse gas because it can absorb infrared radiation, due to the ways in which it can vibrate.
The figure below shows four vibrational modes of carbon dioxide. There is no change in the dipole moment and so there is no absorption of infrared radiation in this mode. However, the infrared spectrum of carbon dioxide shows that the modes shown in (a) and (c) absorb in this region. Notice that in the figure the x-axis represents wavenumber. This is the reciprocal of wavelength (1/λ) and is usually measured in cm-1. Using it makes the numbers more manageable, since the wavelength of the infrared region lies between 2.5 × 10⁻⁵ m and 2.5 × 10⁻⁶ m (wavenumber 400 cm-1 to 4000 cm-1).
In the case of sulfur dioxide, all three vibrational modes lead to infrared absorption. This is because the V-shaped SO2 molecule has a different shape from the linear CO2 molecule, so all three modes lead to a change in the dipole moment. Notice that the absorptions do not occur at the same wavenumbers. This is because the energy required to excite vibration depends on the strength of the bond. As the C=O bond is stronger than the S=O bond, the corresponding vibrations occur at a higher wavenumber in CO2.
As molecules become more complex, so do their vibrational modes. You may meet terms such as scissoring or rocking. Do not worry about these. When you have to interpret an infrared spectrum, look for one or two peaks that are characteristic of particular bonds.
THE INFRARED SPECTROMETER
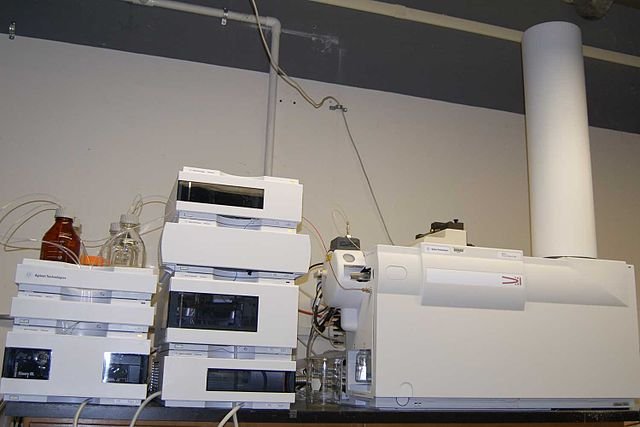
The spectrometer shown in the figure below is a double-beamed instrument, in which one infrared beam passes through the sample and the other passes through the reference cell. The reference cell may contain air, or the solvent of a solid being analysed as a solution. The purpose of the reference is to eliminate absorptions caused by CO2 and water vapour in the air or by the solvent. The difference in the intensities of the two beams is measured by the detector at each wavenumber and fed to the recorder, which produces a spectrum. When the sample does not absorb, there is no peak at that wavenumber; but when it does absorb radiation, the difference in intensities of the two beams produces a peak at that wavenumber.
Notice that when a prism is fitted instead of a diffraction grating, it is made from sodium chloride rather than glass. This is because sodium chloride is transparent to most infrared frequencies, whereas glass absorbs it strongly.
A more sophisticated instrument is the Fourier transform infrared spectrometer, in which a single beam that contains all the required infrared frequencies is passed through the sample. The emerging beam is fed into a computer, which produces an infrared spectrum by a mathematical technique known as Fourier transformation. This instrument has enabled us to understand how photochemical smog develops by analysing samples taken from a 1.6 km long path of air over Los Angeles and determining concentrations of pollutants down to parts per billion (per 109).
PREPARING SAMPLES FOR ANALYSIS
Gases are passed into the sample cell (about 10 cm long), which has sodium chloride windows at each end. Liquids are smeared into a thin film between two potassium bromide or sodium chloride discs. (Sodium chloride is not transparent to all infrared, so potassium bromide, which does not absorb in the infrared spectrum, can be used instead.)
Solids are made either into a solution, or into a disc or a mull. To make a disc, the solid is finely ground with potassium bromide and pressed into a mould under very high pressure. The advantage of a disc is that it produces the spectrum of the pure compound. A mull is made by grinding up the sample with a drop of nujol, a long-chain hydrocarbon. The mull is then smeared between discs, as for a liquid sample. The disadvantage of using a mull is that nujol absorbs infrared radiation, which shows up on the spectrum.
INTERPRETING INFRARED SPECTRA
The spectrum of each and every compound acts like a unique fingerprint and thus makes it possible to identify any compound, often through a computer database. When a totally new compound is discovered, perhaps isolated from a medicinal herb, it will not match any spectrum in the database. But we can still infer a great deal about the compound from the peaks in its spectrum.
For example, the functional group C=O absorbs in the range 1680-1750 cm-1, so a peak in this region is a strong indication that C=O is present. In some examples of bonds and their characteristic infrared absorption bands, you can notice that some bonds give strong absorptions while others are weaker. The explanation lies with bond polarity. When they vibrate, very polar bonds, such as C=O and O-H, are subject to a greater change in their dipole moments than are non-polar bonds, such as C-H. So polar bonds absorb more energy, and thereby give a stronger peak. Finally, the more atoms and bonds there are in a molecule, the more complex its spectrum becomes.
Infrared spectroscopy is rarely used on its own to identify unknown compounds. However, coupled with data from mass spectrometry, gas-liquid chromatography or combustion analysis, it gives important information about the presence of functional groups.
USES OF INFRARED SPECTROSCOPY
Infrared spectroscopy is used at the following places:
1. At the police station
All alcoholic drinks slow down the body’s response times. So drinking and driving can be a fatal combination and anyone driving over the legal limit of 35 micrograms per 100 cm3 of breath is likely to be prosecuted.
The roadside breathalyser gives the first indication that a driver may be over the limit. When a breathalyser test proves positive, the next step is to take the driver to the police station for a more accurate analysis, which is now often carried out using infrared absorption.
2. At the roadside and garage
Infrared spectroscopy is very quick and devices that measure pollution from individual cars can be placed at the roadside or used in the annual MOT test to monitor exhaust emissions. In these cases, the C=O bond in carbon monoxide, the bonds in nitrogen oxides and the C-H bonds in unburnt hydrocarbons all give characteristic absorptions.
3. In the atmosphere
Crucial evidence for the rise of carbon dioxide levels in the atmosphere has been provided by the Mauna Loa observatory in Hawaii (Fig 11.26). The graph of the results from 1958 to the present day is one of the most famous in history and is cited by scientists from around the world when they urge for a reduction in the present output of carbon dioxide emissions.
4. To follow the progress of a reaction
If a reaction involves one functional group changing into another, then the progress of an industrial reaction can be followed using infrared spectroscopy.

Thanks for reading.
REFERENCES
http://www.iuac.res.in/atmol/~safvan/mridulathesis/node18.html
https://www.sciencedirect.com/topics/chemistry/time-of-flight-mass-spectrometry
TIME-OF-FLIGHT MASS SPECTROMETER
http://www.docbrown.info/page04/4_73calcs01ram.htm
https://www.chemguide.co.uk/analysis/masspec/elements.html
https://www.youtube.com/watch?v=XRhLkcXSqfA
https://iopscience.iop.org/article/10.1088/1752-7155/10/1/012001/meta
https://www.sciencedirect.com/topics/chemistry/high-resolution-mass-spectrometry-hrms
https://en.wikipedia.org/wiki/Fragmentation_(mass_spectrometry)
https://www.chemguide.co.uk/analysis/masspec/fragment.html
http://web.mnstate.edu/marasing/CHEM480/Handouts/Chapters/Mass%20Spectroscopy%202013.pdf
http://195.134.76.37/applets/AppletMS/Appl_Ms2.html
http://www.sfu.ca/~vancew/chem380/Lecture5.pdf
https://www.researchgate.net/post/why_chlorine_and_bromine_shows_M_4_and_M_6_peaks_in_mass_spectrum
https://www.chemguide.co.uk/analysis/masspec/mplus2.html
But the end of all things has drawn near. Therefore be sober-minded and be sober unto prayers.(1 Peter 4:7)
Question from the Bible, Who can lead me to heaven?
Watch the Video below to know the Answer...
(Sorry for sending this comment. We are not looking for our self profit, our intentions is to preach the words of God in any means possible.)
Comment what you understand of our Youtube Video to receive our full votes. We have 30,000 #SteemPower. It's our little way to Thank you, our beloved friend.
Check our Discord Chat
Join our Official Community: https://steemit.com/created/hive-182074
This post has been voted on by the SteemSTEM curation team and voting trail. It is elligible for support from @curie and @minnowbooster.
If you appreciate the work we are doing, then consider supporting our witness @stem.witness. Additional witness support to the curie witness would be appreciated as well.
For additional information please join us on the SteemSTEM discord and to get to know the rest of the community!
Thanks for having used the steemstem.io app and included @steemstem in the list of beneficiaries of this post. This granted you a stronger support from SteemSTEM.