Graphing Linear Equations
Hi there. In this math post, I cover the topic of graphing linear equations.

Topics
- The Linear Equation
- Table of Values For Graphing Linear Equations
The Linear Equation
The linear equation consists of a dependent variable that depends on the value of the independent variable. It is common to denote the dependent variable as y and the independent variable as x. The slope of the linear equation is denoted by m. This slope represents the increase in y for every unit increase in x.
The general linear equation is given by y=mx +b.
The amount b is the amount for y when x is 0. This b amount is called the y-intercept.
Example One
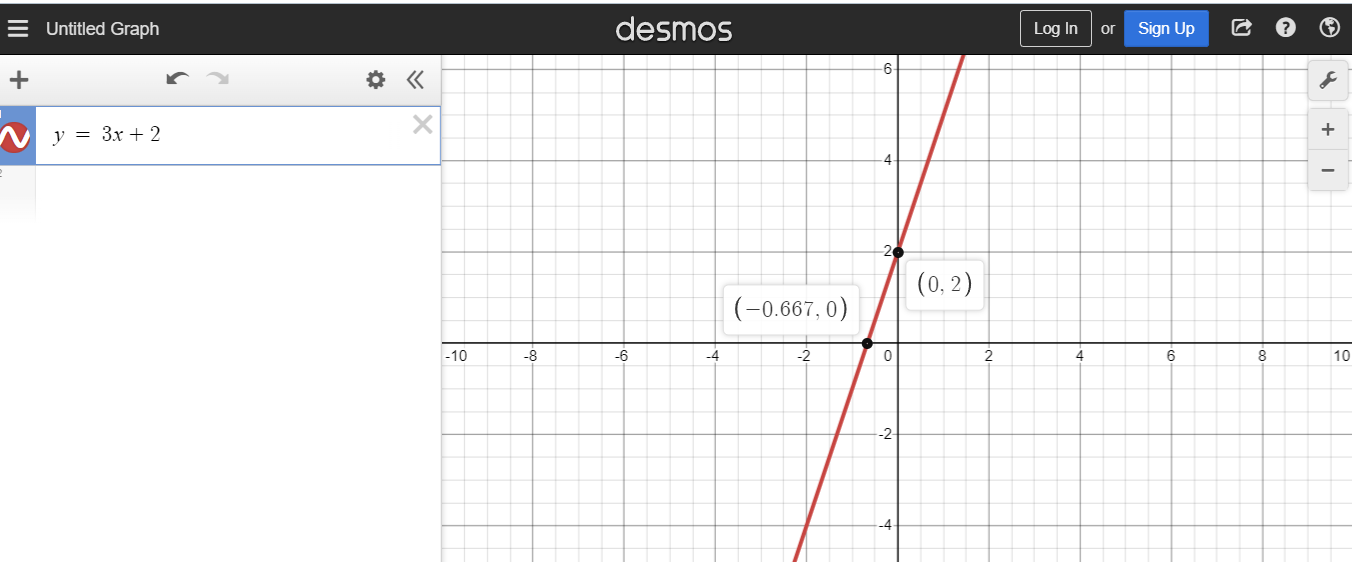
Given a linear equation of y = 3x + 2, the slope is 3 and the y-intercept is 2. I have attached a graphing screenshot below.
Example Two - Lower Slope
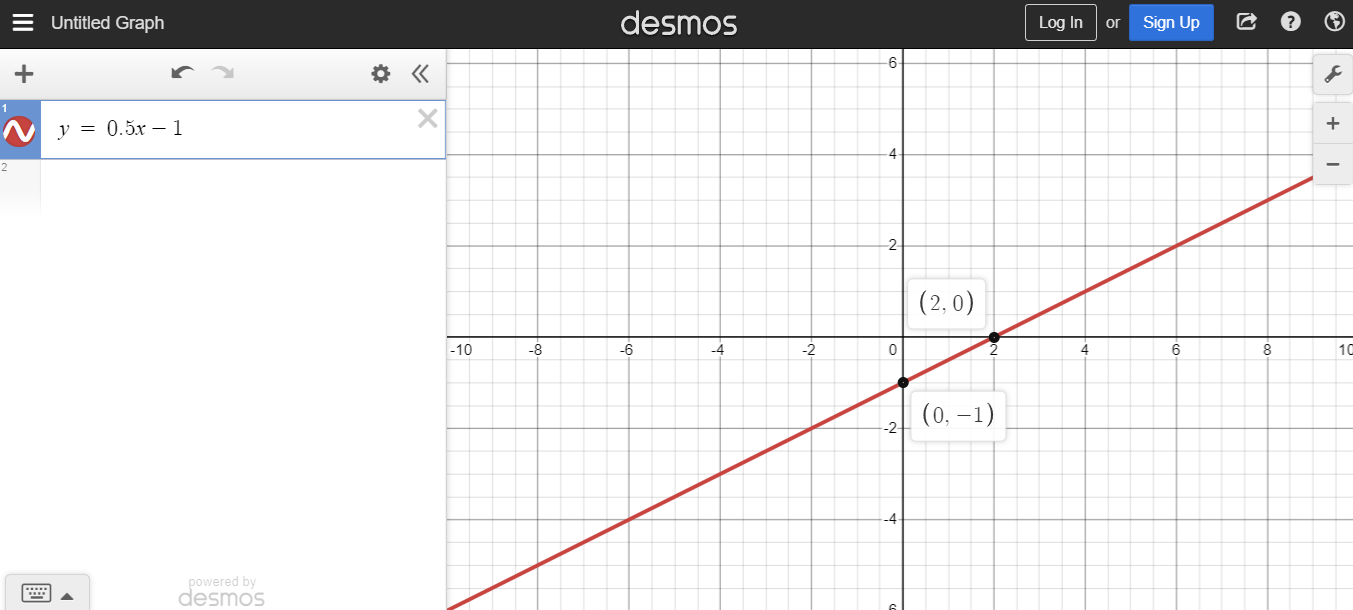
With the linear equation of y = 0.5x - 1, the slope is a half and the y-intercept is negative 1. The slope of 0.5 makes the line less steep or flatter. The line as seen in the screenshot below looks closer to a horizontal line.
Example Three - Negative Slope
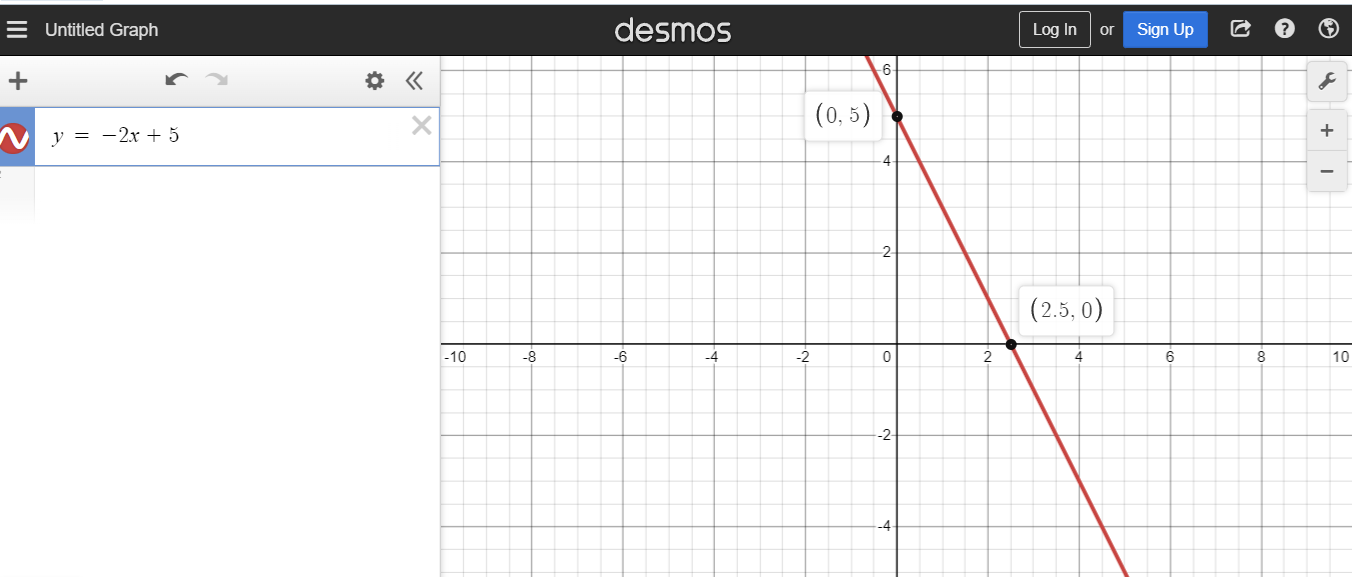
This example deals with a negative slope. Consider the linear equation of y = -2x + 5. The slope is negative 2 which means that there is a decrease in y by 2 for every unit increase in x. When x = 0 the y-value is 5.
Table Of Values For Graphing Linear Equations
In the previous section, I provided the graphed lines that correspond with the linear equation. One way to graph linear equations would be to use a table of values.
Example One
Provide a graph for the linear equation of y = 5x + 20.
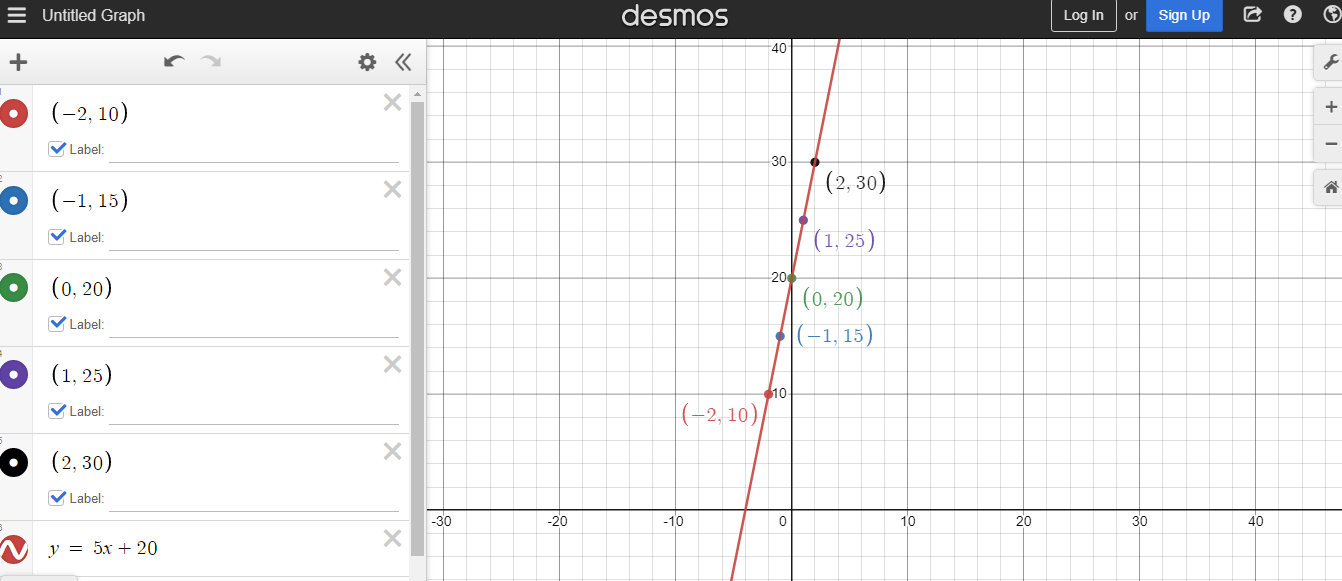
Set up a table of values with x-values of -2, -1, 0, 1, 2 along with the corresponding y-values. I typically like to use small numbers near zero but you can choose any numbers you like. Do keep in mind that some numbers are easier to use than others when it comes to setting the table of values.
When x is negative 2 the y-value is 10. This calculation is from 5(-2) + 20 = -10 + 20 = 10.
| x | y = 5x+20 |
|---|---|
| -2 | 10 |
| -1 | 15 |
| 0 | 20 |
| 1 | 25 |
| 2 | 30 |
The value of y increases by 5 each time x increases by 1. This increase of 5 matches the slope of 5 from y = 5x + 20.
From the table of values you have (x, y) coordinates available for plotting. The points are (-2, 10), (-1, 15), (0, 20), '(1, 25)and(2, 30)`. Once you have about four or five points you can see that the points are arranged in a line. A line can be drawn in a connect the dots fashion. The line graph is shown below (Desmos Screenshot)
Example Two
Provide a graphed line for y = -2x + 5.
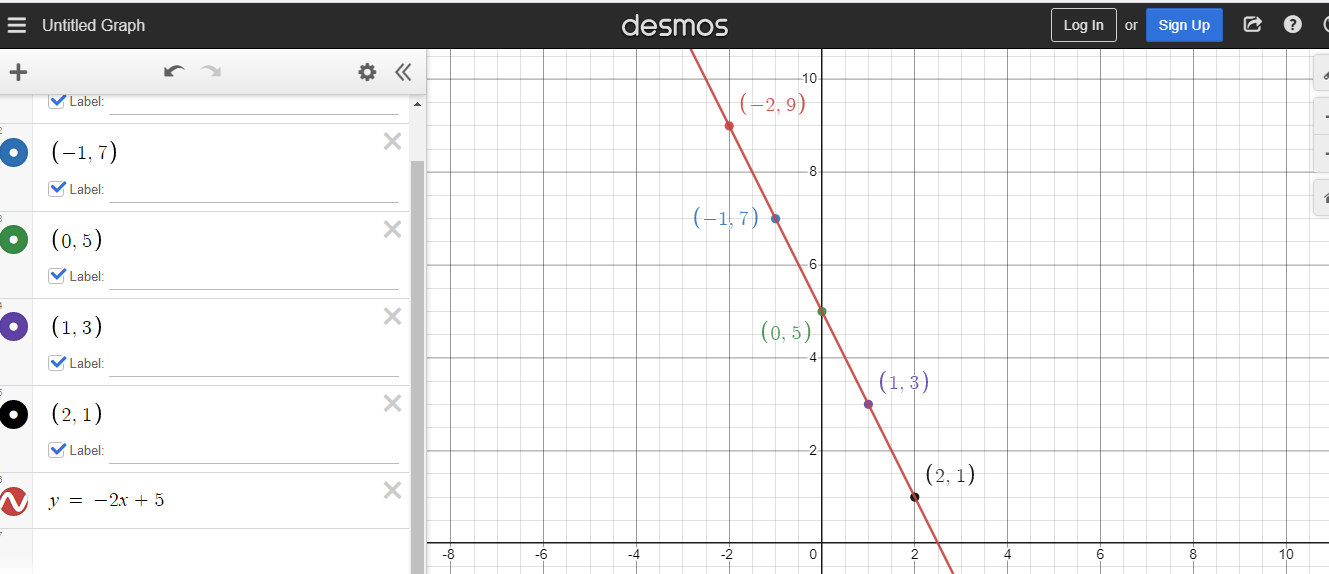
Start with a table of values with x from -2 to +2. The corresponding values are in the right side column.
| x | y = -2x+5 |
|---|---|
| -2 | 9 |
| -1 | 7 |
| 0 | 5 |
| 1 | 3 |
| 2 | 1 |
As the slope is negative two there is a decrease of 2 for every one unit increase in x. Plot the coordinates accordingly and graph the line for the linear equation of y = -2x +5.
Posted with STEMGeeks
Felicidades su publicación ha Sido elegida entre las mejores del día.
SIGA CREANDO BUEN CONTENIDO.
Thanks for your contribution to the STEMsocial community. Feel free to join us on discord to get to know the rest of us!
Please consider delegating to the @stemsocial account (85% of the curation rewards are returned).
You may also include @stemsocial as a beneficiary of the rewards of this post to get a stronger support.