R Language - How to Use tibble Package
In this post, we take a look at how to use tibble package in R. This package is a part of the tidyverse group of packages. These packages make it easy for you to use R and allows you more control over the data analysis and manipulation functions.
If you check some other packages of the tidyverse you would find that they offer lot more flexibility and also give you instant output on some places where required. And that also means you get a good value for your time spent learning them.
Previously I covered the lubridate package in R. This package is another good package which is worth learning if you are from the data science background. Most of my posts would be covering the data visualization and manipulation libraries.
I'd recommend you to download the RStudio which would make it easy to use the R and also get to install the packages easily. Also the visualizing part becomes lot easier. As the IDE has all the tools required for the data analysis and it makes things so easy to use as well.
I have created a video to give you an overview on how to use the tibble Package for the data science work. You should give this one a try.
Let's get started using the tibble package. So if you are not watching the video then the below tutorial would give you a brief idea of the package and you would get a good glimpse with the package.
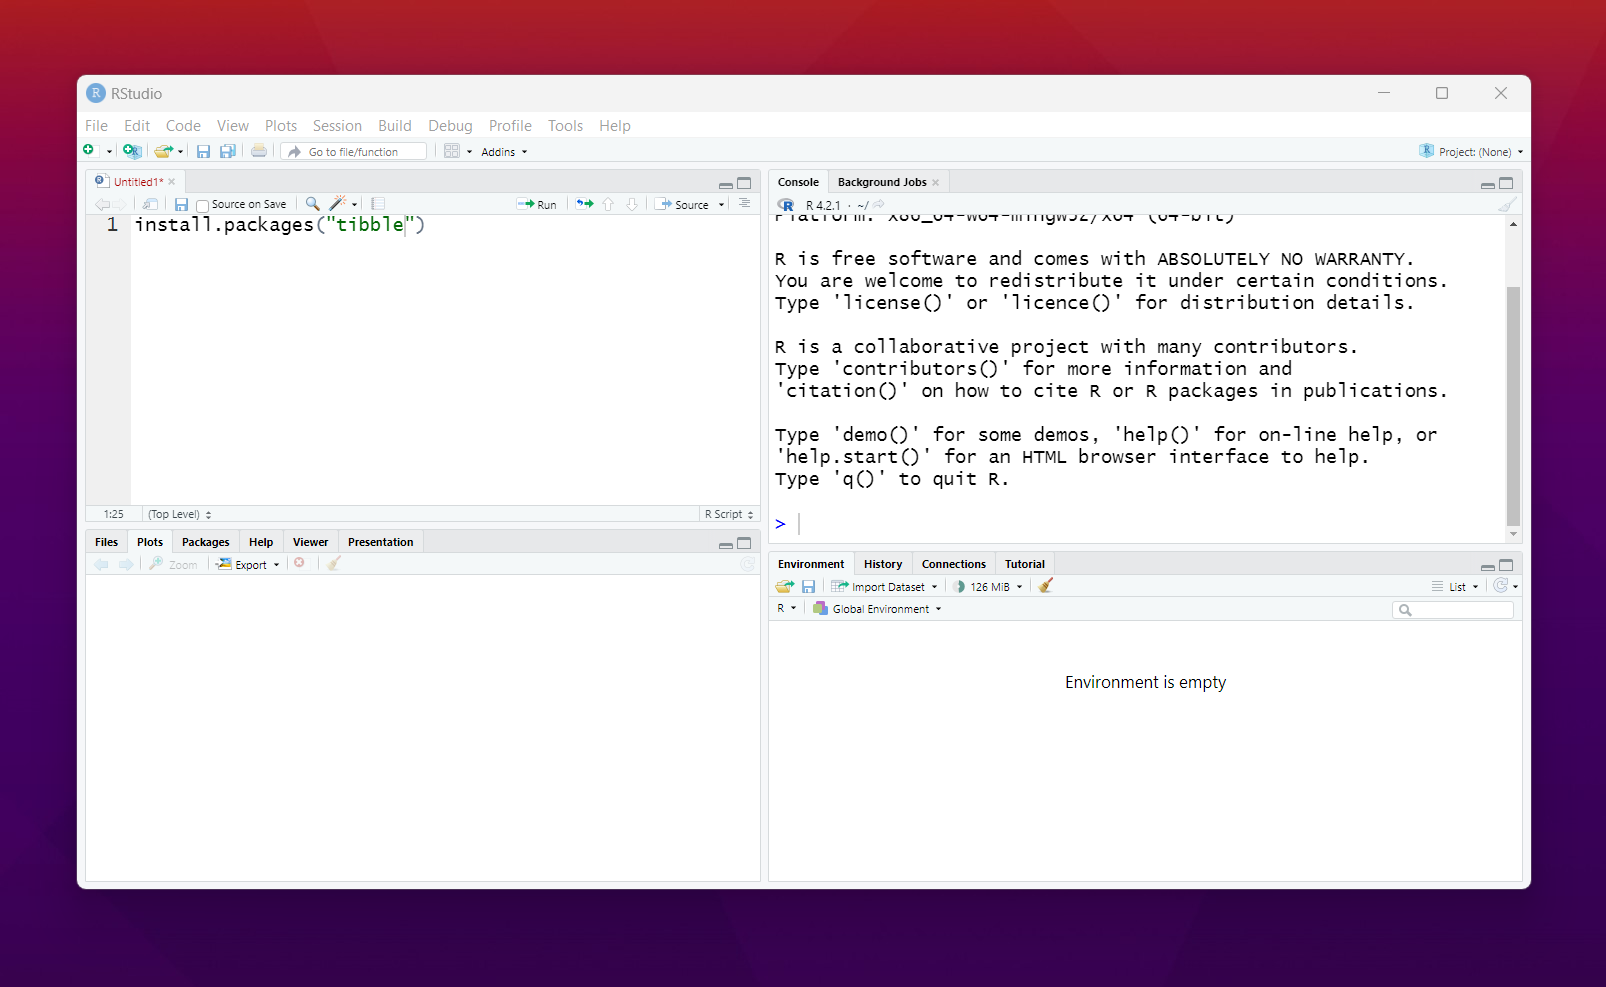
Start by installing the package into the RStudio. Use the below command to do that.
install.packages("tidyverse")
install.packages("tibble")
If you use the tidyverse install, it would install the tibble and other packages but just in case if you wish to install solo package that would be possible too.
Now let's create a tibble which is going to be lot quicker and useful than your typical data frame.
data<- tibble(x = letters, y = 1:26, z = sample(100, 26))
If you check the output you would find the value of the dataframe there. As you can see you can also convert regular data frame into the tibble as well. You can use the function for the same.
as_tibble()
This would give you a good direction for how you choose to do the conversion into the tibble. I prefer this option as it gives you more control on how you attempt the same. You can use the tribble() function too. A lot of cool studd you can explore through the docs from this point onwards.
I would recommend you watch the video as it has some good pointers for you.
There are lot of use cases of this library. Most of the people into the data science use this for the text manipulation use case. Some even use it in other places where you deal with the data frame and the tabular data which is often common for the multiple types of the scenarios.
From now onwards I would like to cover some of the chart and the graph packages. And in that way It would be reasonable to use the packages which can be cool for the simple plots too. So I thought lets cover that each Tuesday in my channel. So if you happen to subscribe to it, you would get some notification about the same.
I hope that you are enjoying some of my R language and data science tutorials. I hope that some of my coverage on this topic would be helpful to you.
If you happen to like this content, do give me feedback over there and that would help me improve my efforts in near future.
I didn't use this package! thanks for showing us

!1UP
You have received a 1UP from @gwajnberg!
@stem-curator, @cent-curator
And they will bring !PIZZA 🍕.
Learn more about our delegation service to earn daily rewards. Join the Cartel on Discord.
I gifted $PIZZA slices here:
@curation-cartel(12/20) tipped @devpress (x1)
Join us in Discord!
Thanks for your contribution to the STEMsocial community. Feel free to join us on discord to get to know the rest of us!
Please consider delegating to the @stemsocial account (85% of the curation rewards are returned).
You may also include @stemsocial as a beneficiary of the rewards of this post to get a stronger support.
@tipu curate
Upvoted 👌 (Mana: 0/46) Liquid rewards.