R Language - How to Use Polygon Plot in R
In this post, we look at How to Use Polygon Plot in R. So earlier I covered Draw function in R language which is kind of easy to make and has multiple options for you to take a look at. So now today I wish to cover the polygon plot in R. And hopefully it would give you an idea on what you can draw with the same.
So if you wish to take a look at some of the earlier posts, I'd recommend check my current profile and also make sure to check the posts Saturdays. I cover most of the science, tech and the code specific tutorials in this series. And I have covered variety of content into this.
I am making use of the base package here, so nothing new to download. And only thing we are supposed to be doing is changing the variables that would produce different set of the polygons. And all of this I am plotting inside the RStudio IDE. I hope that you would find any other ide to plot the same that would give you strong results like this tutorials.
Let's take a look at the new curve function in this tutorial. And I have created a video to give you an overview on How to Use Polygon Plot in R. You should give this one a try.
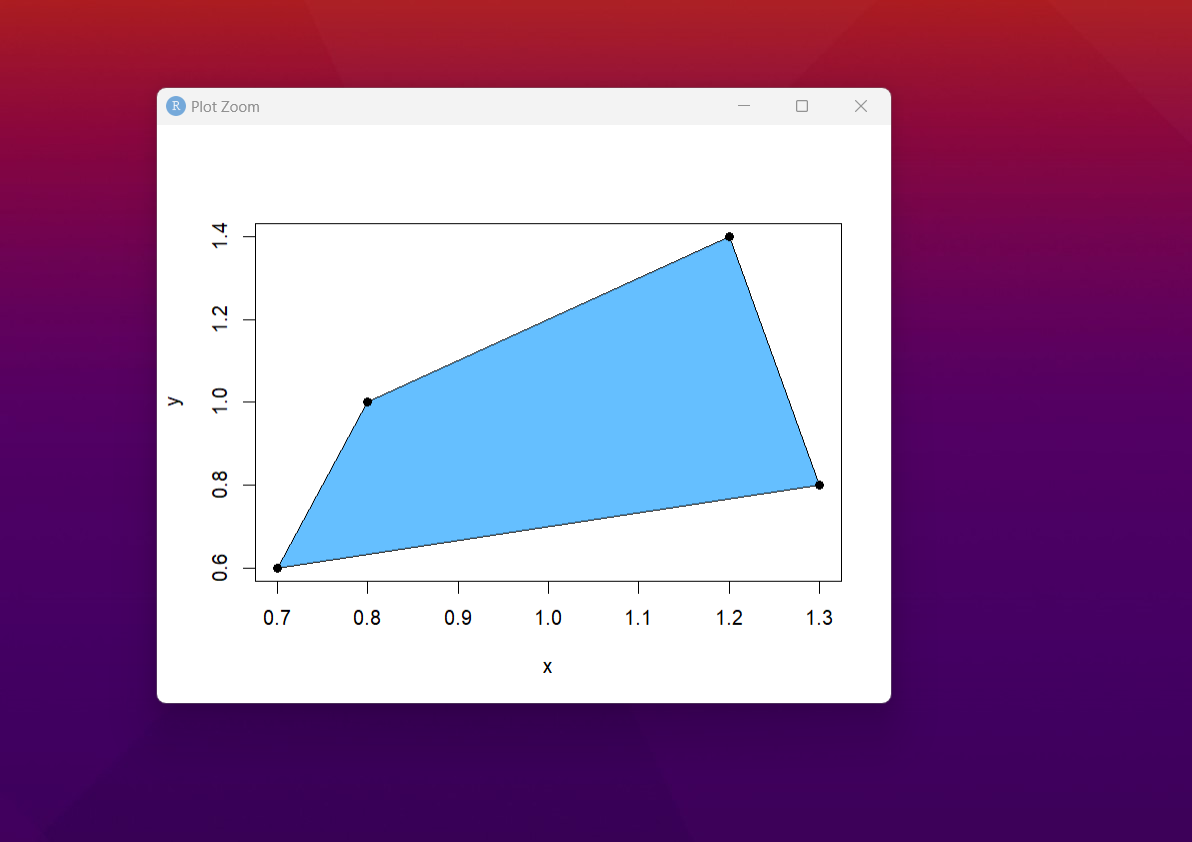
First thing that we would be doing is the data. We have two variables here x and y. We would be adding some data for them.
x <-c(0.7, 1.3, 1.2, 0.8)
y<-c(0.6, 0.8, 1.4, 1)
Next thing we also need to fill our polygon with some sort of a color. We have few options you can pick between these two.
'# 1b98e0 OR # 65BFFF'
Now let's come back to our code that would draw the polygon.
plot(x, y, type = "l")
polygon(x, y, col = "#65BFFF")
You can also add the points too.
points(x, y, pch = 19)
Now let's see how that would look like.
That's it for now. You have designed the polygon plot. And based on the data there are also points for the same. You can easily take a look at the plot and see what works and what does not work for you. And I am sure it would be easier for you to work with. Some of those things would be worth taking a look at as well.
Now we have covered the draw function and also the polygon function. Each of those functions would be drawing specific plots on the screen. Some of these you would like to see drawn on the screen. And you would love taking a look at them as well. Try experimenting with variety of values and draw things.
I hope my series has been useful to some of you. Make sure to check the channel out on the video, and then make sure to share and subscribe. Even if you don't subscribe, please like and share. As that would help my content reach more people. That in turn would be something that would help me out as well.
If you happen to like this content, do give me feedback over there and that would help me improve my efforts in near future.
Thanks for your contribution to the STEMsocial community. Feel free to join us on discord to get to know the rest of us!
Please consider delegating to the @stemsocial account (85% of the curation rewards are returned).
You may also include @stemsocial as a beneficiary of the rewards of this post to get a stronger support.
Amazing
I love your content
So educative
But does the code made a polygon while programing??
Try it :)
Okay
I will code it if it will work