R Language - How to Create Waterfall Plot in R
In this post, we take a look at How to Create Waterfall Plot in R. In case of the charts which are specific to the complex values and the representation is connected on that note. You have to make use of the Waterfall Plots or similar charts that are of type.
Previously I covered the How to Create Stacked Area Plot in R. That was a good attempt at the creation of the plots which can make the stacked area specific observations. So it's a good part that is being covered and you should definitely take a look at.
I have done this tutorial on the RStudio. If you can make use of the jetbrain tools that would be something good for the visualization too. So you have to check what works for you and you have to pick based on that.
I have created a video to give you an overview on How to Create Waterfall Plot in R. You should give this one a try.
Let's start.
We have to make use of the ggalluvial and the waterfalls packages. So first thing we do is add it for our code.
install.packages("ggalluvial")
install.packages("waterfalls")
library(waterfalls)
library(ggalluvial)
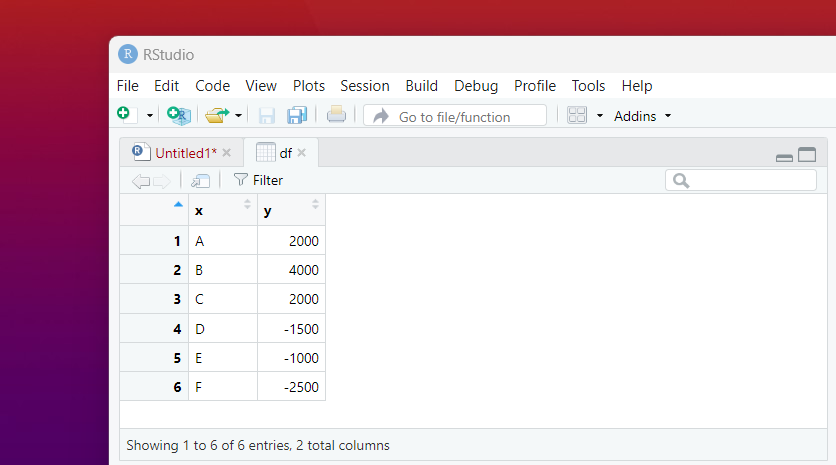
Now that we have to make use of the library. We have to move up for the sample data. You can check that one below.
group <- LETTERS[1:6]
value <- c(2000, 4000, 2000,
-1500, -1000, -2500)
df <- data.frame(x = group, y = value)
You can check the sample data below.
Once you have the data you can take a look at plotting the data using the waterfalls function.
waterfall(df)
That's all. Just take a look at the plot here.
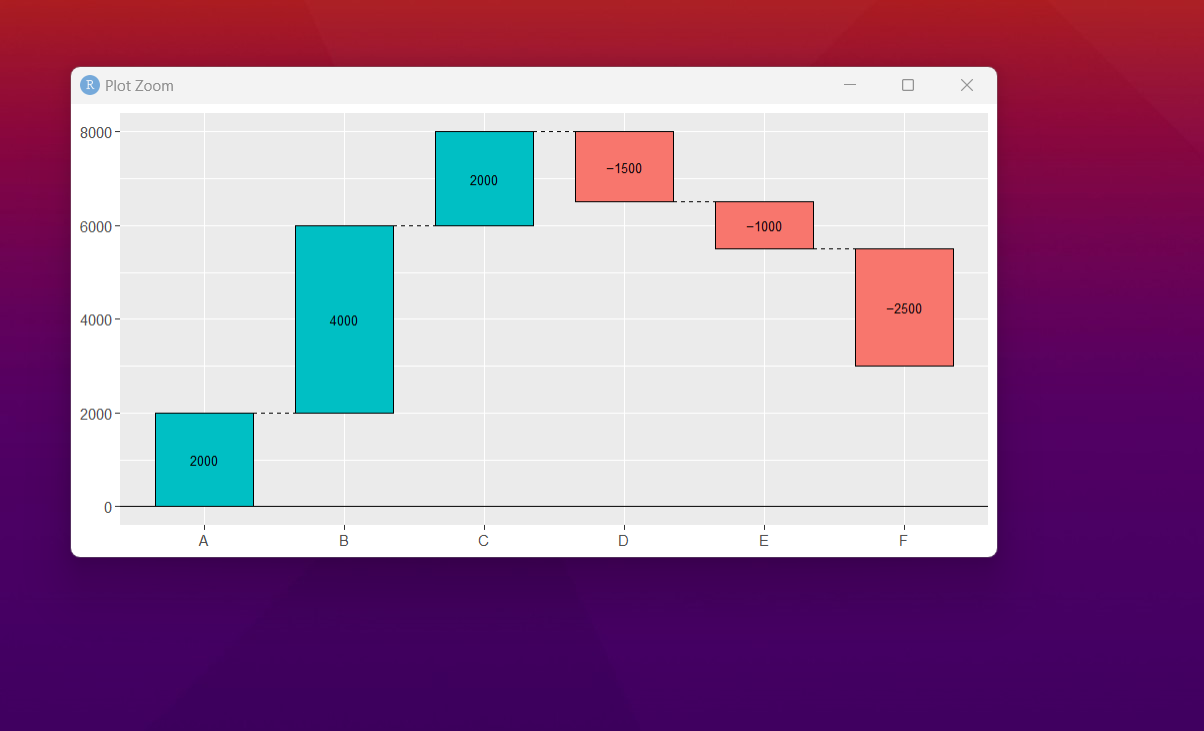
I am sure you would find the plot interesting for anyone who wants to view the graphical representation interesting there.
These tutorials have pretty cool datasets. You should use the kaggle can make use of the data over there and try variety of the plots that I have explained. You can also update the current tutorial with some new type of the dataset from the kaggle from the site.
So experimenting with other dataset can be interesting. If you are a student then definitely try out new dataset. All these visualization exercises can make things easier for you to set up with. So you should consider different datasets as they are better too.
Keep tab on my channel content too. Because I cover a lot of visualization data. Most of such data would help you with the output. I will be covering with the Power BI too. That would also cover a lot of interesting data specific to the data visualization and the analytics.
If you happen to like this content, do give me feedback over there and that would help me improve my efforts in near future.
Thanks for your contribution to the STEMsocial community. Feel free to join us on discord to get to know the rest of us!
Please consider delegating to the @stemsocial account (85% of the curation rewards are returned).
You may also include @stemsocial as a beneficiary of the rewards of this post to get a stronger support.