R Language - How to Create Map in R
In this post, we are going to take a look at How to Create Map in R. This makes use of the maps package in order to create the maps in R. It's a good option for anyone to create map in R. And also the people who wish to use it to create specific maps related datasets in the R language.
Previously, we looked at How to Create Waterfall Plot in R. This is a good plot that you can either use with the plotly and the ggplot2. You choose which library would be good fit for your use case. You can use based on that as well.
Make sure to use the RStudio IDE as it is free and also most of the tutorial that I have covered in the past and current are done with the RStudio. I would say that you can use the Jetbrains and the RStudio IDEs that you would use for your R language plots specific like waterfall, calendar and maps etc. So you may want to try that.
I have created a video to give you an overview on How to Create Map in R. You should give this one a try.
Let's start.
We are going to install two important packages named - tidyverse and the ggplot2. And once we install them we are going to call them. And that would kind of put up the base for our world map type of the map plotting.
library(tidyverse)
library(ggplot2)
What about data? You would find the world map specific data with the following query. So try the below query.
world_coordinates <- map_data("world")
Now let's try and draw the map on the screen. Let's take a look at how things can be plotted on the RStudio IDE.
ggplot() + geom_map(
data = world_coordinates, map = world_coordinates,
aes(long, lat, map_id = region)
)
Let's check the plot.
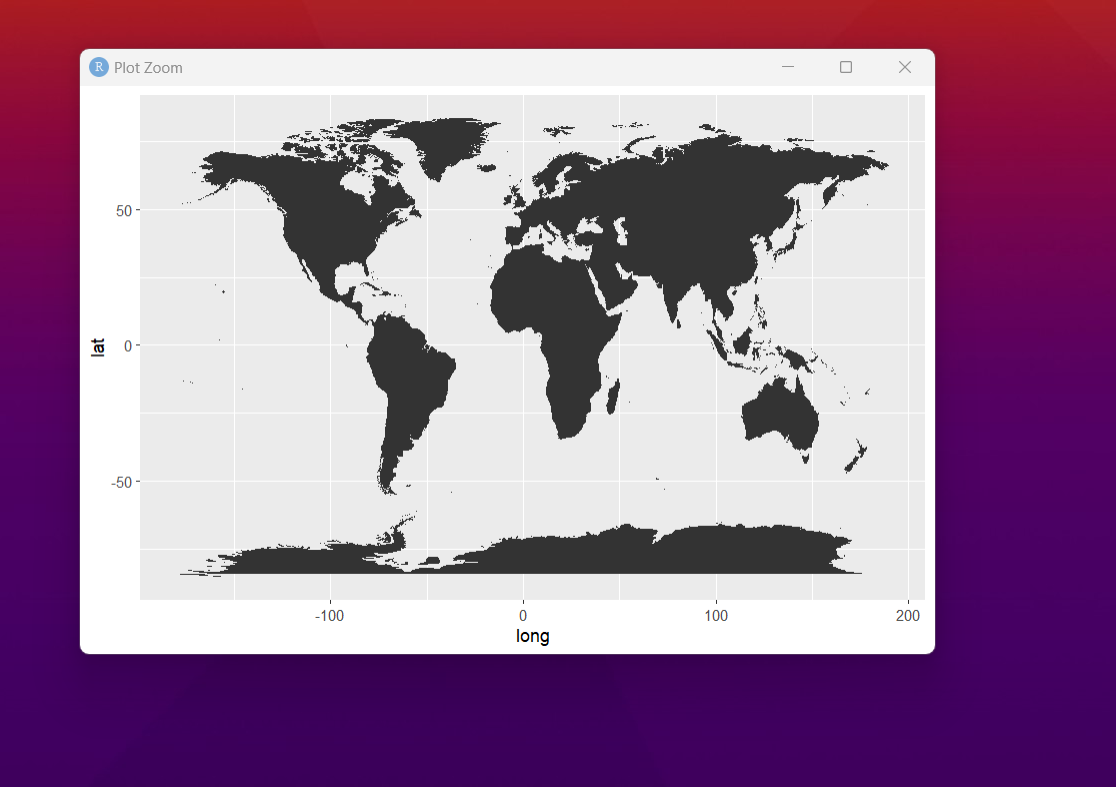
As you can see we are making use of the ggplot to draw the world map plot. And that kind of shows your country and the map of entire world for that matter. So this was an example, you can experiment with smaller maps using the plotly and other library too.
You are not limited to the big maps. You can always use the openstreetmap type of the data and choose the data that suits your code. Some of the data like say road, city and the state kind of shows up in case of the data source that you choose there.
Now I love these type of the small maps where the data related cases can be easily done and drawn too. So you have to think of the variety of options that you can do and use. So in that context I'd say that you should consider making use of the API and library packages that suits this case.
You should definitely get the external datasets like say in the map specific services. There are some of the new services out there for the dataset. So we have to make sure to use those which would be useful in our case. I'd say you should use that based on what you can use in that case. I recommend making use of the same for experimental data and plots.
I am making some good tutorials on the youtube specific to the data science. I cover most of the simple topics which could be of help for you. I know there are many small topics that if checked can help a lot of users too. So make sure to check these videos and the tutorials. Do request any specific topic if you are interested.
Do keep tab on some of my content if you are interested. Like it could be Tuesday and the Friday when I post most of the content. And it works out pretty cool for most of the topics which would be of use for you. In that sense, I'd recommend you to use the maps library.
If you happen to like this content, do give me feedback over there and that would help me improve my efforts in near future.
Thanks for your contribution to the STEMsocial community. Feel free to join us on discord to get to know the rest of us!
Please consider delegating to the @stemsocial account (85% of the curation rewards are returned).
You may also include @stemsocial as a beneficiary of the rewards of this post to get a stronger support.