Python Seaborn - How to Create Swarm Plot in Python
In this post, we take a look at How to Create Swarm Plot in Python using Seaborn. Previously we looked at how to create strip plot in python using seaborn. And I also explained some of the configuration for that chart. So here I want to show you how to create the swarm plot in Python.
Swarm plot is a good plot for visualizing limited set of the data points and one of the variable in a categorical order. It is more or less complementary plot for the violin and the box plot. Which you can easily check and also learn how to make use of as well.
I am using the jupyter notebook to compile these plots and show you the output in the web browser. You can also make use of the other options available be it on cloud or any other desktop options. Which would make you draw the plots and get the output of your choice.
And I have created a video to give you an overview on How to Create Swarm Plot in Python using Seaborn. You should give this below video a look.
First thing to check is that you have Python installed. And then you can verify the python version using the command below.
python --version
next thing make sure to setup the following libraries.
pip install numpy pandas jupyter seaborn matplotlib
Now we make sure to open the jupyter notebook in the browser and for that command would be something like below.
jupyter notebook
and now we have to take a look at the code.
First thing we would be doing is making sure to import the necessary libraries.
import seaborn as sns
import matplotlib.pyplot as plt
next thing you should do is make sure to import the tips database. This database is good for those who want to make simple chart of the swarm. So we make use of this.
tips = sns.load_dataset("tips")
Next thing we make use of the swarmplot function to draw the swarm plot and then get the output plotted on the screen.
sns.swarmplot(x="day", y="total_bill", data=tips)
plt.show()
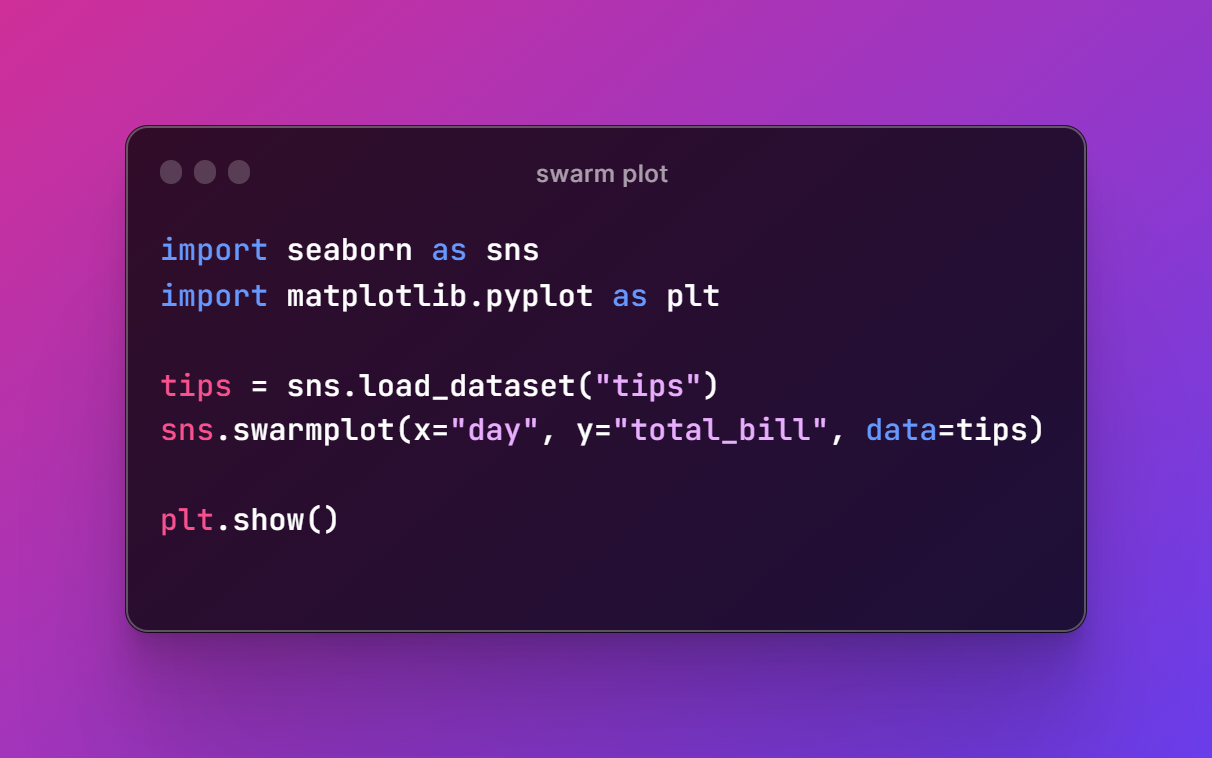
Now let's take a look at the entire code.
import seaborn as sns
import matplotlib.pyplot as plt
tips = sns.load_dataset("tips")
sns.swarmplot(x="day", y="total_bill", data=tips)
plt.show()
And now we can make use of the reference image for the code just for those who want to keep it.
Now once you run the above code in the jupyter notebook you would have the output that looks like the below image. It should allow you to make the swarm plot.
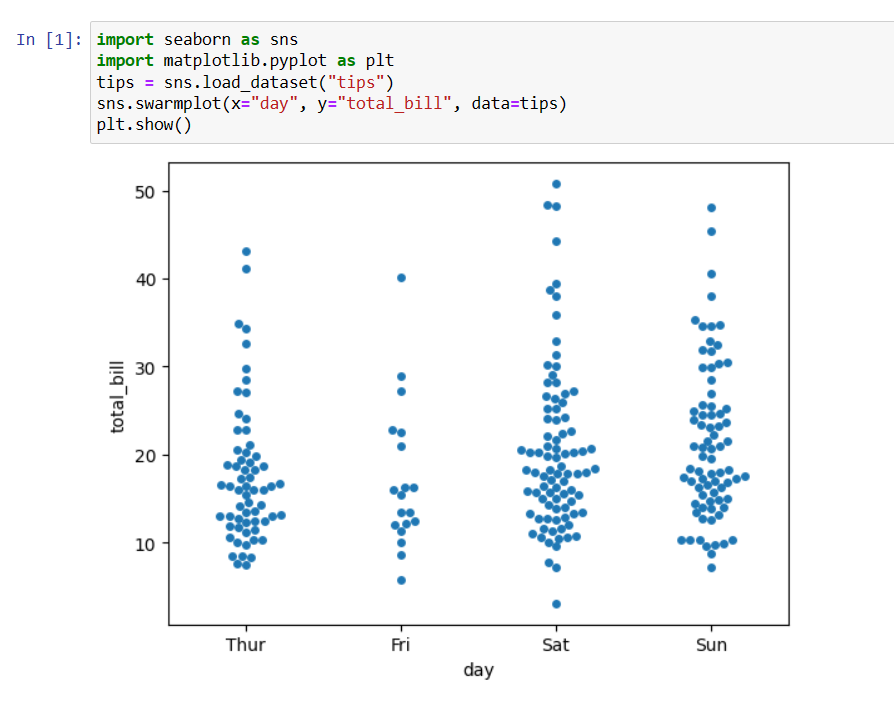
That's it. You now have the swarm plot. Now just don't settle for this there are more things you can do with it. You can make sure to change the theme of the plot. And also make sure to change the size variable and that also changes the output. A lot of interesting things you can do from this point onwards. You would love plotting swarm plot from this point onwards if you do it right.
Next thing you should do is make sure to like, share and subscribe. I have been covering some good amount of the data science tutorials. In near future there would be a lot of cloud based tutorials that I would be covering. So if you are into the data science this would surely help you with some small examples. It also helps me if you subscribe :)
If you happen to like this content, do give me feedback over there and that would help me improve my efforts in near future.
Congratulations @devpress! You have completed the following achievement on the Hive blockchain And have been rewarded with New badge(s)
You can view your badges on your board and compare yourself to others in the Ranking
If you no longer want to receive notifications, reply to this comment with the word
STOPCheck out our last posts:
Thanks for your contribution to the STEMsocial community. Feel free to join us on discord to get to know the rest of us!
Please consider delegating to the @stemsocial account (85% of the curation rewards are returned).
You may also include @stemsocial as a beneficiary of the rewards of this post to get a stronger support.