Python Seaborn - How to Create Scatter Plot in Python
In this post, we look at How to Create Scatter Plot in Python. Previously we looked at the pair plot in python using seaborn. In this tutorial, I am going to be covering the scatter plot and this time I would be making use of the Seaborn library of the Python language.
Scatter plot can be both 2D and 3D depending on the type of the variables that you use. And for this particular tutorial I am making use of the fmri dataset. You can check that dataset here. I am linking github source file for you to explore.
I am assuming that you have python installed. We can verify the installation and also talk about other libraries to install with the current setup. I am making use of the jupyter notebook. And hopefully you can follow along and get the results at the end of the tutorial.
And I have created a video to give you an overview on How to Create Scatter Plot in Python using Seaborn. You should give this below video a look.
First thing to do is making sure that you have the python installed on your machine. And for that you can make use of the command below.
python --version
Second thing make sure to setup the following libraries. You can use the below commands to set the libraries up there.
pip install numpy pandas jupyter seaborn matplotlib
Next thing is we make sure to run the jupyter notebook. This would help us open up the jupyter for running the notebook.
jupyter notebook
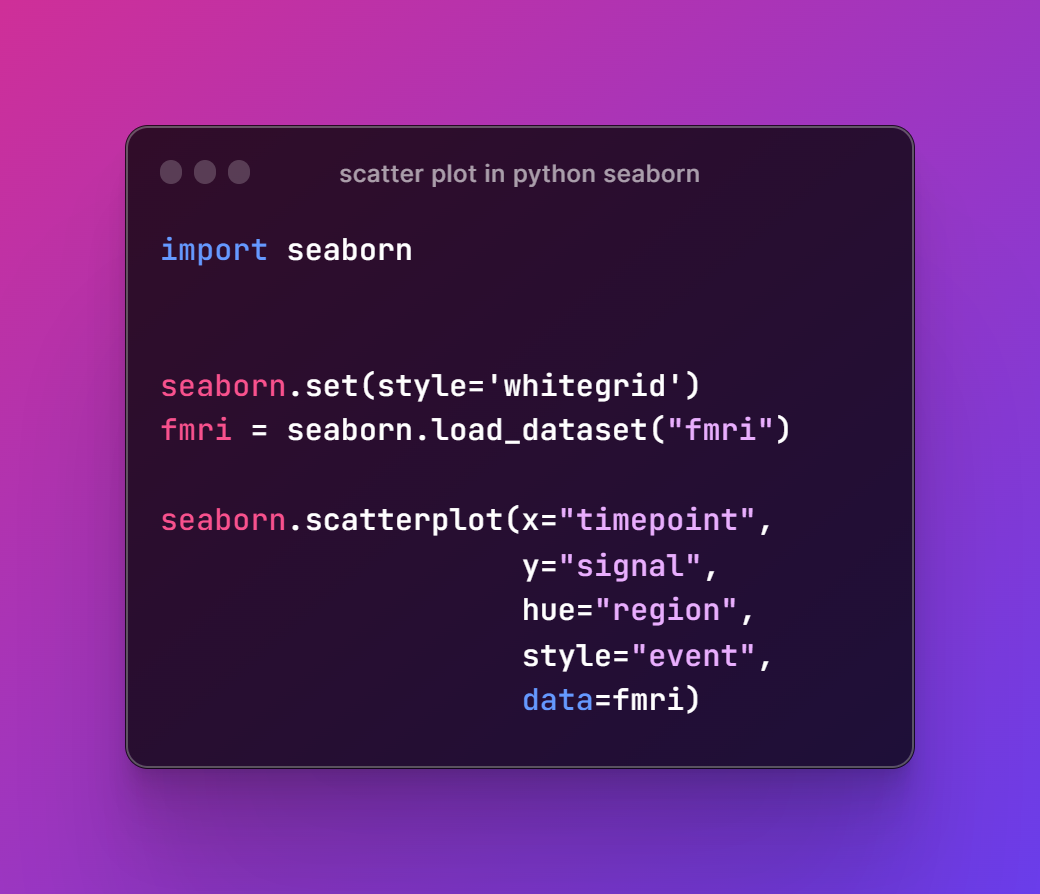
Let's talk about code once you open the python notebook. Below is the first thing is reference to the seaborn library.
import seaborn
next thing you should think of the fmri dataset that we have just given the reference. We also set the style there.
seaborn.set(style='whitegrid')
fmri = seaborn.load_dataset("fmri")
Next thing we are going to plot this data. And we are going to use configs that we can pass on and plot the scatter plot.
seaborn.scatterplot(x="timepoint",
y="signal",
hue="region",
style="event",
data=fmri)
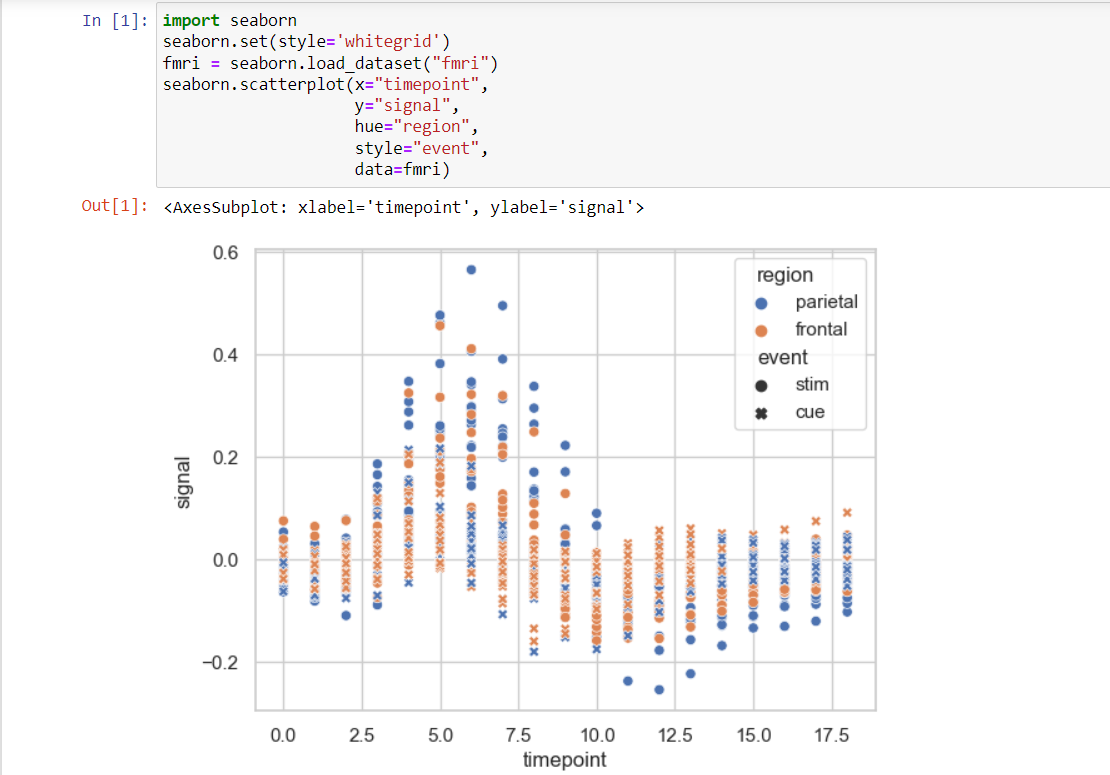
Run the code in the notebook and that would give you the plot. So here's the image reference of entire code.
Next thing once you run the code you would be able to get the plot. And you would see that changing the variables, dataset and the few styles would change the way the scatter plot would be looking at.
That's it. We have made a simple scatter chart. You can always make changes to this data and choose your own look for the scatter plot. I would say you should try with the dataset like tips and few others. So it would be a fun to try there for the variety of the configurations.
I hope you like the tutorial. I have just added the simple example but if you choose you can make it even more complex based on the data and also experiment with the styles that you can make use of. So this would be a good option. Now make sure to like, share and subscribe to the channel by visiting the video posted above. This should help you get regular such good content.
If you happen to like this content, do give me feedback over there and that would help me improve my efforts in near future.
This was a down vote because of lack of engagement from this person. All discussion can be found on this post
https://peakd.com/hive-196233/@devpress/when-you-execute-map-changes-rule-changes-time-changes
The content of these posts are interesting and good but the lack of respect in responding to comments is what is causing this.
I read that and understand where you're coming from and didn't mind the downvotes on the posts in your community but from what I see he does engage on the platform quite daily overall so I think you're taking it a bit too far. It's one thing to note lack of engagement and not curate posts and mute from a community but another to start downvoting them and crossing over to posts not in your community. Please reconsider this action.
I don’t doubt he engages elsewhere and am just trying to get the point across - if someone comments on your post it behooves you to reply back at least once. It’s the least you could do.
I wasn’t going to go and down vote all his posts, as I said I appreciate his content I’m just trying to get him to realize that we are promoting interaction here.
I certainly may have been a little more zealous than I should have been! Like i said I was going to keep an eye on him for a few weeks to sincerely hope that he improves his comments to people that stop by his posts.
Congratulations @devpress! You have completed the following achievement on the Hive blockchain And have been rewarded with New badge(s)
You can view your badges on your board and compare yourself to others in the Ranking
If you no longer want to receive notifications, reply to this comment with the word
STOPCheck out our last posts:
Thanks for your contribution to the STEMsocial community. Feel free to join us on discord to get to know the rest of us!
Please consider delegating to the @stemsocial account (85% of the curation rewards are returned).
You may also include @stemsocial as a beneficiary of the rewards of this post to get a stronger support.
Hey @devpress i removed my down vote on here, acid counteracted it quite well and has vouched for you which is always good. I just want you to understand that this community is an awesome place and it’s grown to what we’ve got here because people talk to people. We don’t post and just leave, that’s not how you build a platform and a community.
I hope to see you commenting back if someone gives you a reply, it’s a simple but important gesture of community!
I don’t want you to leave, I want you to grow!