Python Seaborn - How to Create Pair Plot in Python
In this post, we take a look at How to Create Pair Plot in Python. Previously we looked at the how to create violin plot in Python Seaborn. And for this tutorial, I am going to take a look at the Pair Plot in Python using Seaborn.
Where do we make use of the Pair Plot? And where is the use case? There are some datasets where you have the variables that have the pair relationships. And in order to represent them into the chart, you make use of the pair plot and display them accordingly in the pairs.
Now next part is making sure you have the setup. So install the python and also install the libraries explained below. You would be able to get the libraries explained below. Also you can use the cloud services if you can with the jupyter notebook. So worth trying as well.
And I have created a video to give you an overview on How to Create Pair Plot in Python using Seaborn. You should give this below video a look.
First thing is checking if you have the Python installed. And for that you can make sure to run the commands in the command line.
python --version
And now we would be making use of the libraries that you can install for playing this tutorial out so try the below command.
pip install numpy pandas jupyter seaborn matplotlib
Here you can see that you are supposed to run the notebook using the following command.
jupyter notebook
Next thing to do is making sure to try out the code in the notebook. Here you have to create the python notebook and also the version is 3 as of time of writing. As for the next thing is we need a dataset which is "tips". Check the example.
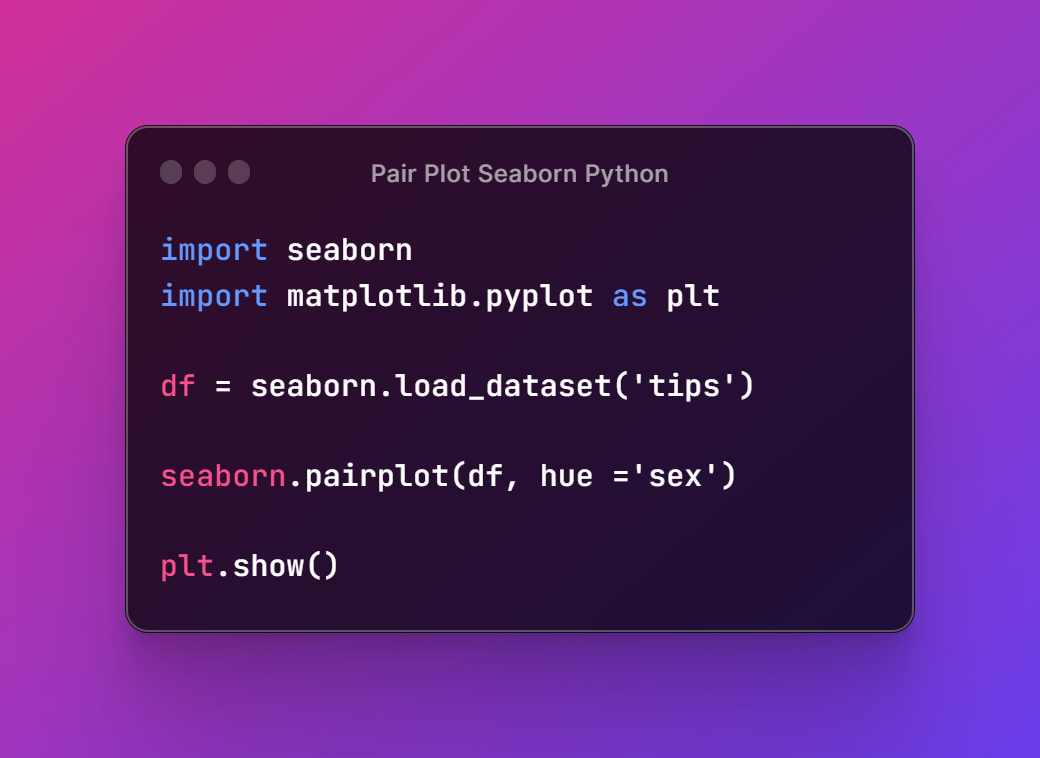
Here the seaborn reference would be used first.
import seaborn
import matplotlib.pyplot as plt
and the next thing is making sure to load the tips dataset.
df = seaborn.load_dataset('tips')
We can now try to get the data specific for the same for the sex in the dataset.
seaborn.pairplot(df, hue ='sex')
Finally we need to show the plot on the screen.
plt.show()
I have created entire code into the whole with the image. You can check the below image for the reference.
Now let's move onto the jupyter notebook and make sure to add your code from here and then make sure to hit the run tab. This would produce the output shown below.
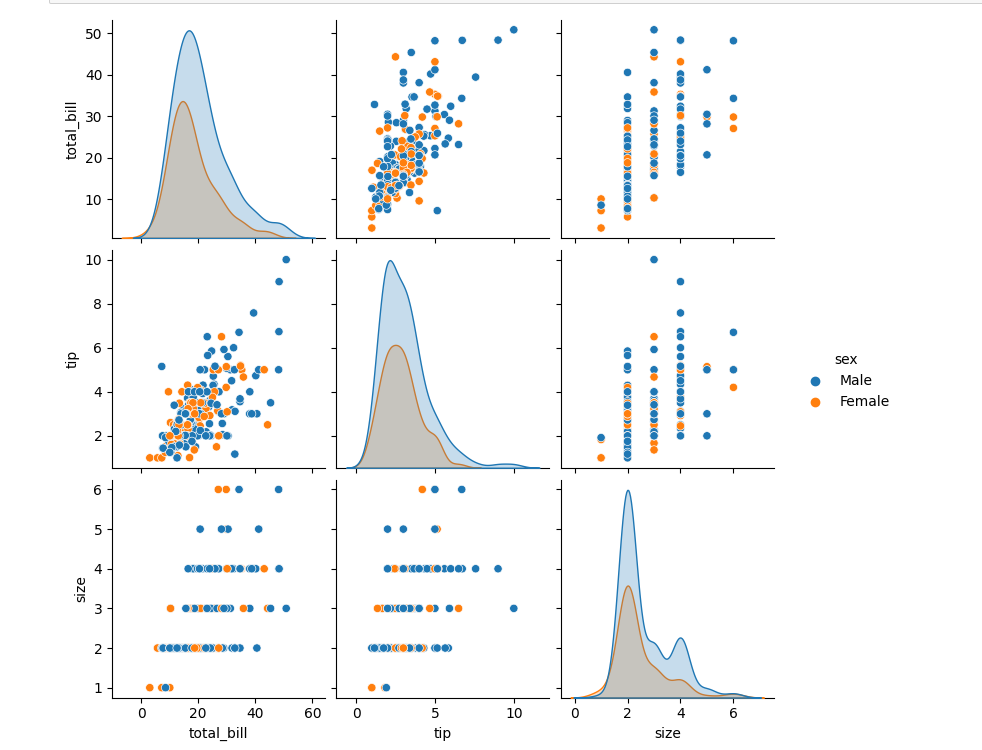
As you can see the example for the tips database. And now the data is out with the pair plot and also there seems to be a good output if you change the dataset. I would recommend changing the themes and also the dataset. Small config changes can produce some really good examples for you to try out with.
I hope that you liked the tutorial. This is specific for the seaborn library. And now soon I would be going cloud only tutorial and hopefully that would help me with the variety of the database and the config related changes. If you like my tutorials, like, share and subscribe to the channel by visiting above URL. I would appreciate if you join the channel sub.
If you happen to like this content, do give me feedback over there and that would help me improve my efforts in near future.
Thanks for your contribution to the STEMsocial community. Feel free to join us on discord to get to know the rest of us!
Please consider delegating to the @stemsocial account (85% of the curation rewards are returned).
You may also include @stemsocial as a beneficiary of the rewards of this post to get a stronger support.
Congratulations @devpress! You have completed the following achievement on the Hive blockchain And have been rewarded with New badge(s)
You can view your badges on your board and compare yourself to others in the Ranking
If you no longer want to receive notifications, reply to this comment with the word
STOP