Python Matplotlib - How to Create Stacked Bar Chart in Python
In this post, we take a look at How to Create Stacked Bar Chart in Python. Previously we covered how to create Treemap chart in Python Matplotlib. Now we are going to check out the stacked bar chart in python. Considering the treemap chart which was meant for the specific type of the data say like the data that is often similarly used for the donut chart or so. You can alos use the treemap in same fashion.
For this tutorial, Like most of the previous tutorials, I am going to be making use of the Visual Studio Code and for that matter you can use any cloud IDE or the IDE that you are familiar with. Only requirement is making sure that you have the Python and the matplotlib installed. And once you do, then it would be easier for you to work with the code and give some result there.
So basically you have to setup the python environment. Next you have to install few libraries and also going to make use of the code given in this tutorial to use it for execution and the output of the chart. This way you would be making much better use of the stacked bar chart in python. I have noticed how that goes and I feel by following the tutorial you should consider following along each step and work around with.
And I have created a video to give you an overview on How to Create Stacked Bar Chart in Python. You should give this one a try.
First thing make sure to check out that you have python installed.
python --version
and now we would be installing the packages which would help you setup with the packages that we are using to make the stacked bar chart.
pip install numpy, jupyter matplotlib
And now the next thing would be to bring out the test data which we would be making use of for the output of this chart.
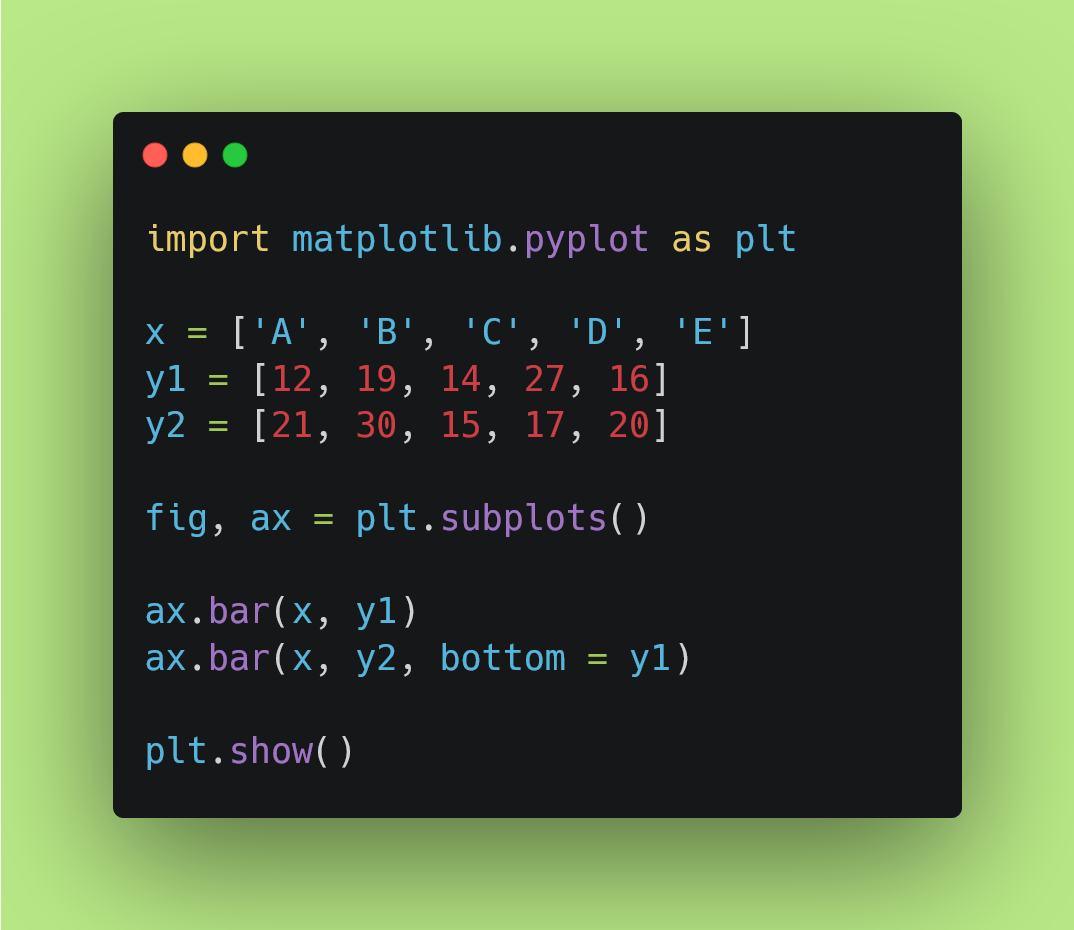
Now that we have the test data we can go ahead and write the rest of the code that would be plotting the chart.
import matplotlib.pyplot as plt
x = ['A', 'B', 'C', 'D', 'E']
y1 = [12, 19, 14, 27, 16]
y2 = [21, 30, 15, 17, 20]
fig, ax = plt.subplots()
ax.bar(x, y1)
ax.bar(x, y2, bottom = y1)
plt.show()
You can create a python file and save it with something like say example.py or the demo.py. Next part is executing the python file. And that would produce the results too.
python example.py
You can check the image of the code for reference that you can use later.
Once you execute then you can see the plot as well. We have managed to use only two bars in it and that is why we have such output.If you add the y3 and also add some values for the same this would give you the more values for the bar chart. That is how it should be for the values that you add in the chart.

This chart as you can see has specific set of the colors.You can even change them and get better output too. Like you want specific themes that is also possible.and another thing is that you would be getting some better designs and the border color change too. I have seen some really good output in that context. My goal was just to give an idea of the chart and from there onwards you can extend and work with the variety of the values there.
You can also change the width of the bars, you can have the theme or the colors. All of that would add up on the chart overall.But it depends on how much you want to tweak. Because you know doing too much has no value in itself and some of the time you have to experiment with the charts and the values that would give you some reasonable output to work with. You can add error bars,you can also add the legend at the side of the chart and that would work too.
I have one more month left for the charts. And once that is done we would be off to another year with some other topic. Because this one has ended and we have to move on with the teaching and hopefully we have to conduct different topics for now. Hopefully I can come up with something better andthat would also save my time too. But for now these are few weeks left for the tutorials and then we would be changing a lot of our pattern too.
I hope you are enjoying my tutorials. I just need morereach on the youtube but so far both the views, reach, subscribers and the likes are down. So if you can help me out with the either one would help me. Each time I would publish something new that would help me out too. It can be slow with the income these days with the youtube but I have to keep posting and trying out as well. I guess it would take some more time subscription and the publication for me to work with the content. So hoefully that works out for me as well. Please like, share and subscribe on youtube.
If you happen to like this content, do give me feedback over there and that would help me improve my efforts in near future.
Congratulations @devpress! You have completed the following achievement on the Hive blockchain And have been rewarded with New badge(s)
You can view your badges on your board and compare yourself to others in the Ranking
If you no longer want to receive notifications, reply to this comment with the word
STOPCheck out our last posts:
Thanks for your contribution to the STEMsocial community. Feel free to join us on discord to get to know the rest of us!
Please consider delegating to the @stemsocial account (85% of the curation rewards are returned).
You may also include @stemsocial as a beneficiary of the rewards of this post to get a stronger support.