Python Matplotlib - How to Create Hexbin in Python
In this post, we take a look at How to Create Hexbin in Python. Previously we looked at how to create heatmap in python using Matplotlib. Now that heatmap was being used in variety of use case you can see that it kind of helps with the simple dataset specific to the analytics and the other use cases. So this time we look at the hexbin.
So where exactly is the use case of the hexbin? You can use the hexbin where the use case of the scatter plot is not easier. Like say when you have too many data plots, you tend to make use of the hexbin. Simple equation would be more data points the better use of the hexbin chart. And most of the data sets which are specific for the hexbin can be easily be used as well.
You can make use of the hexbin for the simple data set that I am about to explain in this tutorial. So make sure to install the libraries that I am explaining below. You can setup the cloud based setup of the jupyter and the python. Another alternative is the thing that you would have to explore the additional learning through the docs and the changes in the dataset. So that you can experiment and keep on trying for more.
And I have created a video to give you an overview on How to Create Hexbin in Python. You should give this below video a look.
First thing you should do is make sure to have the python installed on the Windows.
python --version
Second thing is that you have to get the libraries installed on the machine too.
pip install numpy, jupyter matplotlib
Third make sure to run the jupyter on your system and open the notebook using the below command.
jupyter notebook
Now you can go ahead and make sure to run the notebook for running the code into the notebook and also make sure to open python notebook.
Next thing is calling for the library references.
import numpy as np
import matplotlib.pyplot as plt
nex thing we would be needing the code for the data. like say sample data so we start with the seed.
np.random.seed(8)
next sample data would be like this
x = np.random.normal(0, 1, 1000000)
y = 3 * x + 5 * np.random.normal(0, 1, 1000000)
Next we have to learn to plot the rest.
fig, ax = plt.subplots()
ax.hexbin(x = x, y = y)
plt.show()
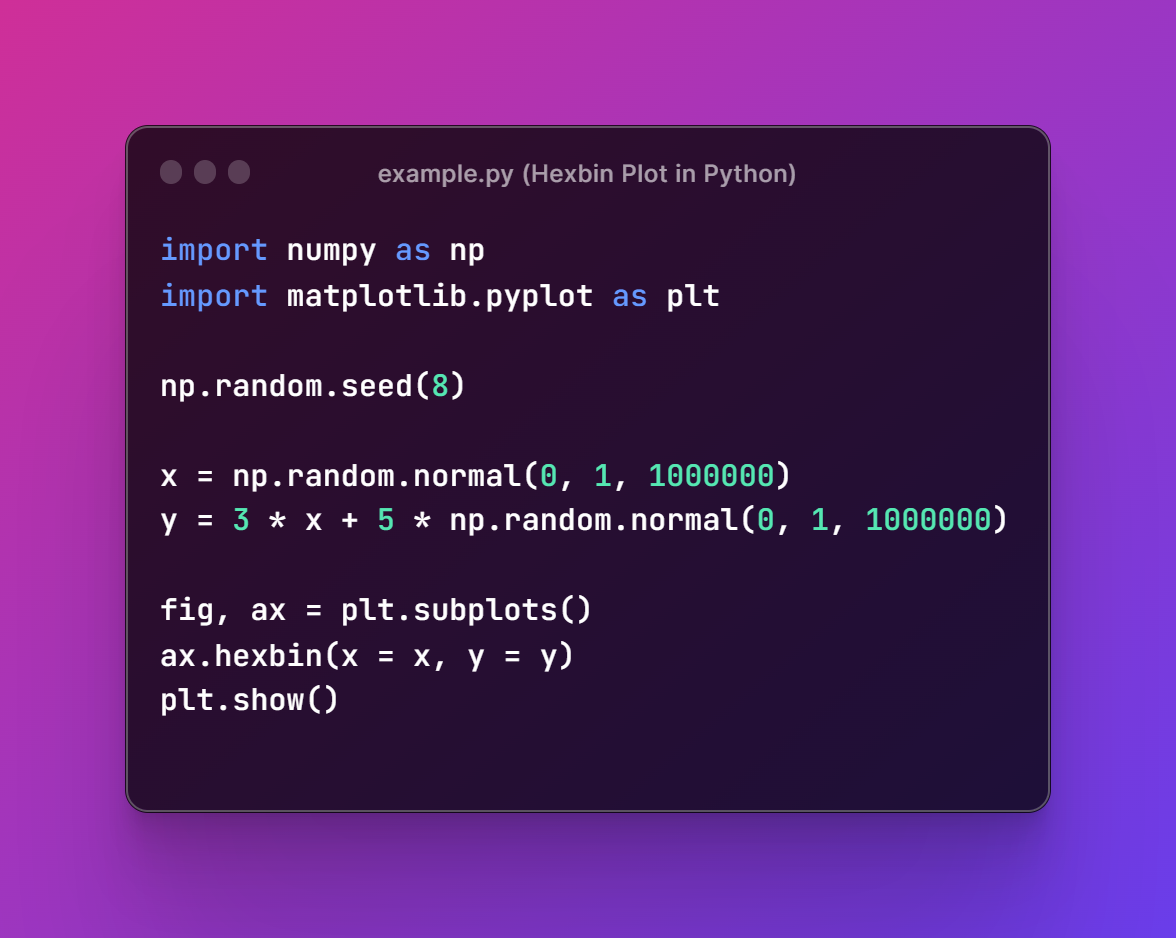
Now entire code would look something like this.
import numpy as np
import matplotlib.pyplot as plt
np.random.seed(8)
x = np.random.normal(0, 1, 1000000)
y = 3 * x + 5 * np.random.normal(0, 1, 1000000)
fig, ax = plt.subplots()
ax.hexbin(x = x, y = y)
plt.show()
You can check out the code below in the image as well which would be easir for you to read.
Now I assume you have code written in the file say some example.py and you can run the code now with below command.
python example.py
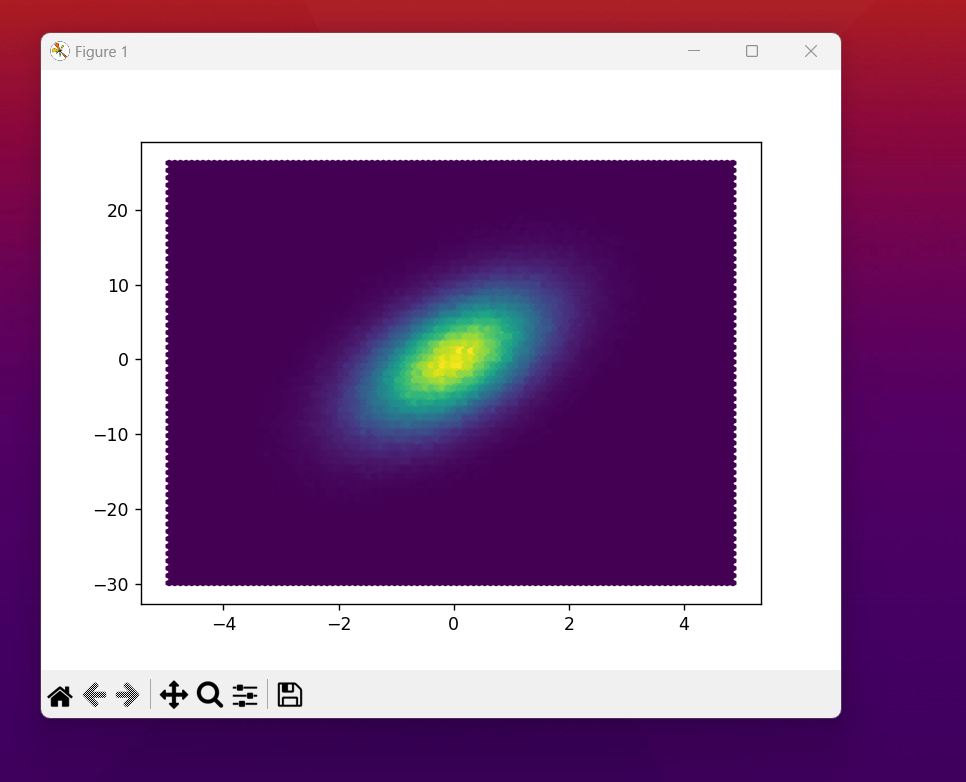
This should produce the outcome like the image below.
That's it. You have a lot of things to explore from this point onwards. Like you have to handle the grid size, bins, transparency, border color and color palette. These are some of the thing you can explore. Depends on what you want to achieve and want to show up on the dataset. So it all depends on your requirement and also the things that you wish to add up on the chart there. Some of the really good things you have to explore there. I have learned this from experience and things to be learned from the approach that is out there if you ask me.
I hope the content you have seen here you can also learn how the interesting things can be there in the plots with the matplotlib. I can show you there some really good tutorials if you choose to follow my videos in the playlist of the python data science. So hopefully you would find the video tutorials here useful but you have to like, share and subscribe to the channel. Find the above video to go to the channel and you would find some really good tuesday and friday tutorial posting routine for you to explore as well.
If you happen to like this content, do give me feedback over there and that would help me improve my efforts in near future.
Congratulations @devpress! You have completed the following achievement on the Hive blockchain And have been rewarded with New badge(s)
You can view your badges on your board and compare yourself to others in the Ranking
If you no longer want to receive notifications, reply to this comment with the word
STOPThanks for your contribution to the STEMsocial community. Feel free to join us on discord to get to know the rest of us!
Please consider delegating to the @stemsocial account (85% of the curation rewards are returned).
You may also include @stemsocial as a beneficiary of the rewards of this post to get a stronger support.