Python Matplotlib - How to Create Heatmap in Python
In this post, we take a look at How to Create Heatmap in Python using Matplotlib. Previously we loked at how to create contour plot in Python using Matplotlib. You used the contour plots when you wanted to plot the 2 independent points and one dependent point. And its for 2 dimmensional plot with 1 dimmensional output.
For this tutorial we are going to take a look at the heatmap. We can take a look at the color coded heatmap with specific systems there. Usually analytics and the variety of the data patterns make use of the heatmap to show specific presence of certian variables. And those variables give them more specific output and that would be a good option for them to work with the events in the dataset and the data being represented in the heatmap.
I assume that you have managed to setup the environment so that you can execute the code explained below in the tutorial. Make sure to install the recommended libraries below. If you can use the jupyter notebook online in the cloud that is fine too. You just have to find out the environment level that matches with the library that you can get with the output as expected below if everything is setup fine.
And I have created a video to give you an overview on How to Create Heatmap in Python. You should give this below video a look.
First thing make sure to install the python and second you can setup the environment there. You can verify the python version using the command below.
python --version
Next is make sure to setup the libraries in the command here.
pip install numpy, jupyter matplotlib
Once you have the libraries you can go ahead and then verity the notebook. You can check the below command and then make sure to run it as required.
jupyter notebook
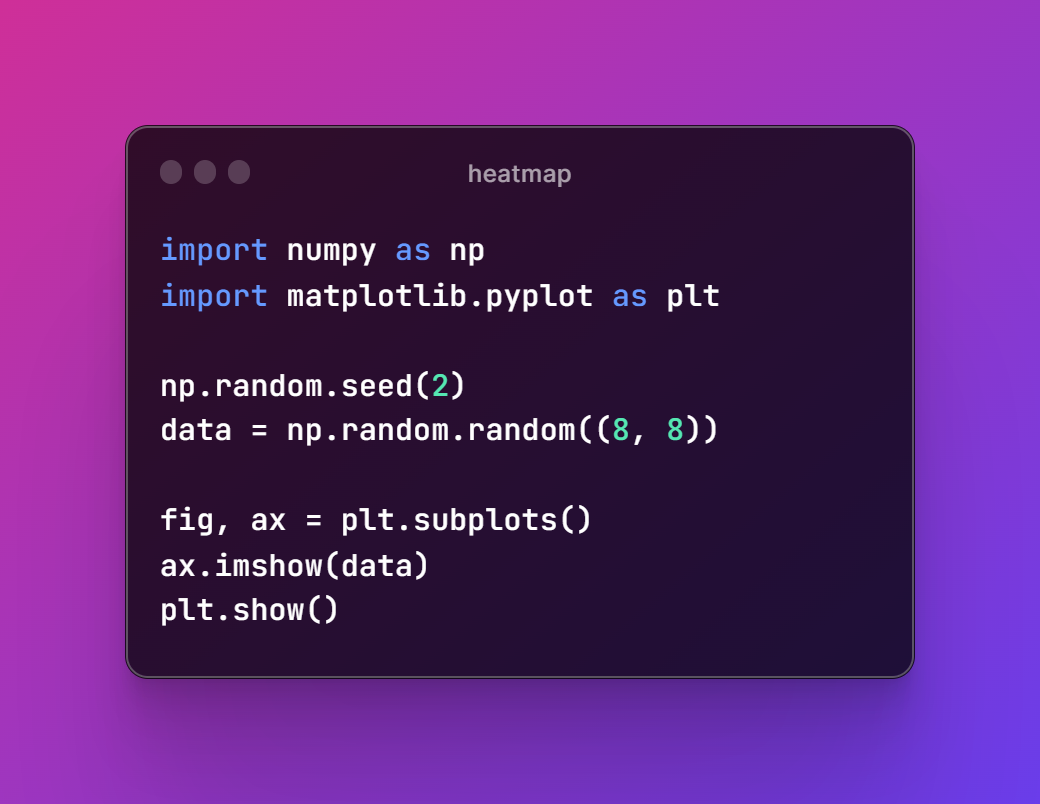
Now let's take a look at the references that we have to make for the code here.
import numpy as np
import matplotlib.pyplot as plt
Once you give the reference for the code, you can now check out the sample data.
np.random.seed(2)
data = np.random.random((8, 8))
Now it's time to display our plot and for that we write the entire code.
import numpy as np
import matplotlib.pyplot as plt
np.random.seed(2)
data = np.random.random((8, 8))
fig, ax = plt.subplots()
ax.imshow(data)
plt.show()
You can save the code in the below image reference for you to check for the future.
Now I assume that you have written the code in the example.py file. And now you can execute this file through the following code.
python example.py
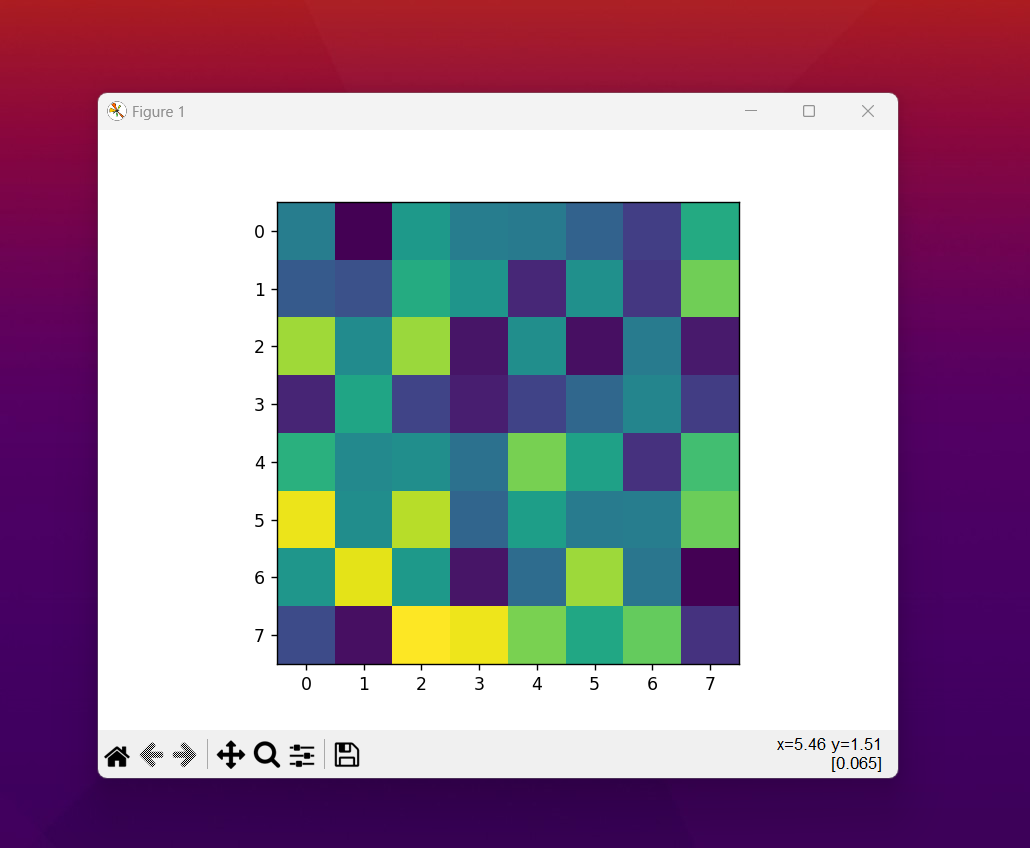
Once you run the code below you can get the output in the window that looks like this.
You can now extend this map with the help of groups, index, legend and even the color themes. Variety of other configurations are possible with the heatmap and you can use the same for the values that you add up and make the configuration changes there. I know a lot of people find that not so easy but it can be done. As many people have done this before and it can be done again with change in few values. So I suppose you can easily do this with few of the pointers from the documentations which you can explore as well.
I hope that this tutorial helps you with the design and the development of variety of the plots. I have like few more plots left and from there onwards we can go ahead and then take the plots of other libraries with little bit of the change in the refernecing of the code. Most of the people out there can easily do that. You can make use of the likes, share and also do make sure to use the comments on the video if possible. I would appreciate if you can subscribe and that would help me a lot. Any engagement that you do on youtube for my video and channel is much appreciated.
If you happen to like this content, do give me feedback over there and that would help me improve my efforts in near future.
Thanks for your contribution to the STEMsocial community. Feel free to join us on discord to get to know the rest of us!
Please consider delegating to the @stemsocial account (85% of the curation rewards are returned).
You may also include @stemsocial as a beneficiary of the rewards of this post to get a stronger support.
Congratulations @devpress! You have completed the following achievement on the Hive blockchain And have been rewarded with New badge(s)
You can view your badges on your board and compare yourself to others in the Ranking
If you no longer want to receive notifications, reply to this comment with the word
STOPCheck out our last posts:
Su publicación ha sido votada por @Edu-venezuela, se trasladará a otros proyectos de curación para obtener más apoyo. ¡Sigan con el buen trabajo!