Region of Interest for the Image.
Region of Interest (ROI)
Region Of Interest ROI, is just a part of the image which we want to analyze or taken out to study. The portion of the the image is filtered out to perform various operations for example in satellite imaging if we want to find the hideout of some criminals we narrow the area and the concentration is focused only in that particular area. That area becomes the region of interest.
We can have more than one ROI depending on the need. Suppose there is an image of the road containing 2, 3 potholes and we want to beautify that road, so we select those regions which have potholes and fill that region with the image of the road so that the end result may appear to be smooth.
There are many ways to demonstrate ROI, here in this blog I am going to show how to take the ROI from the image and how to fill ROI in the image using python.
Program
Importing the python packages
import cv2
import numpy as np
import matplotlib.pyplot as plt
Reading the image and displaying it
image = cv2.imread('27962498773_311bdba7b2_c.jpg')
image = cv2.cvtColor(image, cv2.COLOR_RGB2BGR)
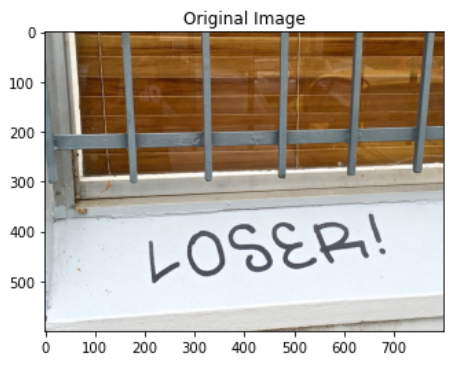
plt.title('Original Image')
plt.imshow(image);
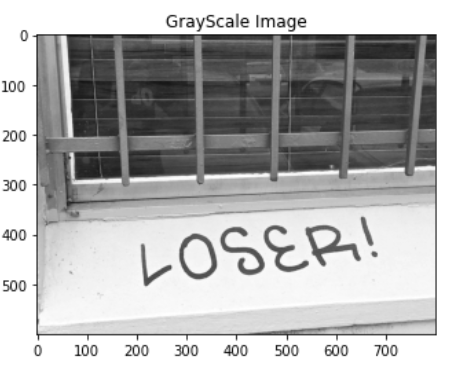
Taking the Gray Scale Image to simplify the process.
grayImage = cv2.cvtColor(image, cv2.COLOR_BGR2GRAY)
plt.title('GrayScale Image')
plt.imshow(grayImage, cmap='gray');
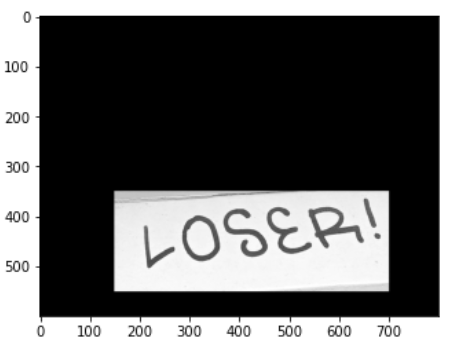
Taking the Region of Interest of the image.
Here I want to take the LOSER part of the image so the co-ordinates are taken in that way.
roi = np.array([[(150, 550), (150, 350), (700, 350), (700, 550)]])
Filling the Region Of Interest
fillroi = np.zeros_like(grayImage)
regionOfInterest = cv2.fillPoly(fillroi, roi, 255)
display_regionOfInterest = cv2.bitwise_and(grayImage, regionOfInterest)
plt.imshow(display_regionOfInterest, cmap='gray');
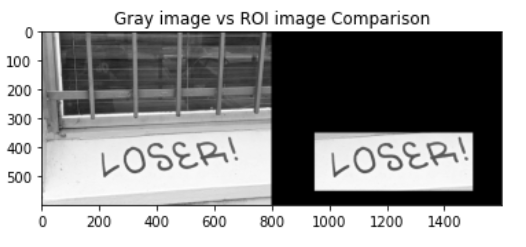
Showing the Grayscale Image and ROI image side by side.
result = np.hstack((grayImage, display_regionOfInterest))
plt.title('Gray image vs ROI image Comparison')
plt.imshow(result, cmap='gray');
Tools Used: Jupyter NoteBook
Python Libraries: OpenCV, numpy, matplotlib
Explanation
The original image is taken and converted into grayscale to simplify the process. We want to take the portion of the image which contains the word LOSER!. The image is plotted using matplot.pyplot library of pythonand the dimensions of the image is seen. The roi variable is taken which contains the the dimensions of the region of interest. The regionOfInterest is taken and fillPoly() method of the OpenCV is used to fill the region with white. (255 is used for white). bitwise_and function of OpenCV is used perform the operation on grayscale image and regionOfInterest. The selected portion is filled and displayed in the plot.
Previous Blogs related to Computer Vision
References: Wikipedia, learningaboutelectronics website, personal prepared notes
Reference 1 Reference 2
Image Source:
I tried to make the code simple to understand and gave explanation of the various functions used in the program. Feel free to give your suggestions. Until we meet again in some other post, this is @biggestloser signing off....

Electronic-terrorism, voice to skull and neuro monitoring on Hive and Steem. You can ignore this, but your going to wish you didnt soon. This is happening whether you believe it or not. https://ecency.com/fyrstikken/@fairandbalanced/i-am-the-only-motherfucker-on-the-internet-pointing-to-a-direct-source-for-voice-to-skull-electronic-terrorism
Nice post as always :)
But please use codeblocks for code examples
Noted...
Thanks for the suggestion...
Congratulations @biggestloser! You have completed the following achievement on the Hive blockchain and have been rewarded with new badge(s) :
Your next target is to reach 700 upvotes.
You can view your badges on your board and compare yourself to others in the Ranking
If you no longer want to receive notifications, reply to this comment with the word
STOPTo support your work, I also upvoted your post!
Check out the last post from @hivebuzz: