LEO price and LEO activity correlation ? Analysis using Linear Regression .
Good evening to everyone . This week has been crazy for all people in the crypto world . The crazy bear market has left many worried but few other see this as an opportunity to just buy more and be more involved in the crypto .
I belong to the latter category . I am here to stay .
Anyway coming to the point , we always talk about the activity on Hive being affected by price of Hive . Although this time Hive is holding pretty strong , the LEO price has taken a hit so I thought of doing some analysis on "How much does the price affect the activity?"
Is it possible to find such a relationship ?
Yes , it is . There is something called as Linear Regression which allows us to find the correlation between two variables ( or say factors ) .
Before we move on , you have to know this -
The coefficient of determination is a statistical measurement that examines how differences in one variable can be explained by the difference in a second variable, when predicting the outcome of a given event. In other words, this coefficient, which is more commonly known as R-squared (or R2), assesses how strong the linear relationship is between two variables, and is heavily relied on by researchers when conducting trend analysis.
Today I will be doing it for both LEO as well as Hive .
Before I go to the data part , here are the steps I have followed
- I have taken comments made with #leo , #leofinance and some other community tags . So basically every single comment made on LeoFinance ( Irrespective of Frontend used )
- I have taken the data for the period - April 1st to May 25th .
- I have taken comments made on Hive from April 1st to May 25th too .
- I then retrieved the data for LEO price against HIVE from April 1st . I calculated the LEO to HIVE price as well as LEO to USD price based on Hive price .
- I got the HIVE historical price from COINGECKO.
- Contains both post as well as comments data.
Data analysis for LEO activity
Let us see the LEO activity first
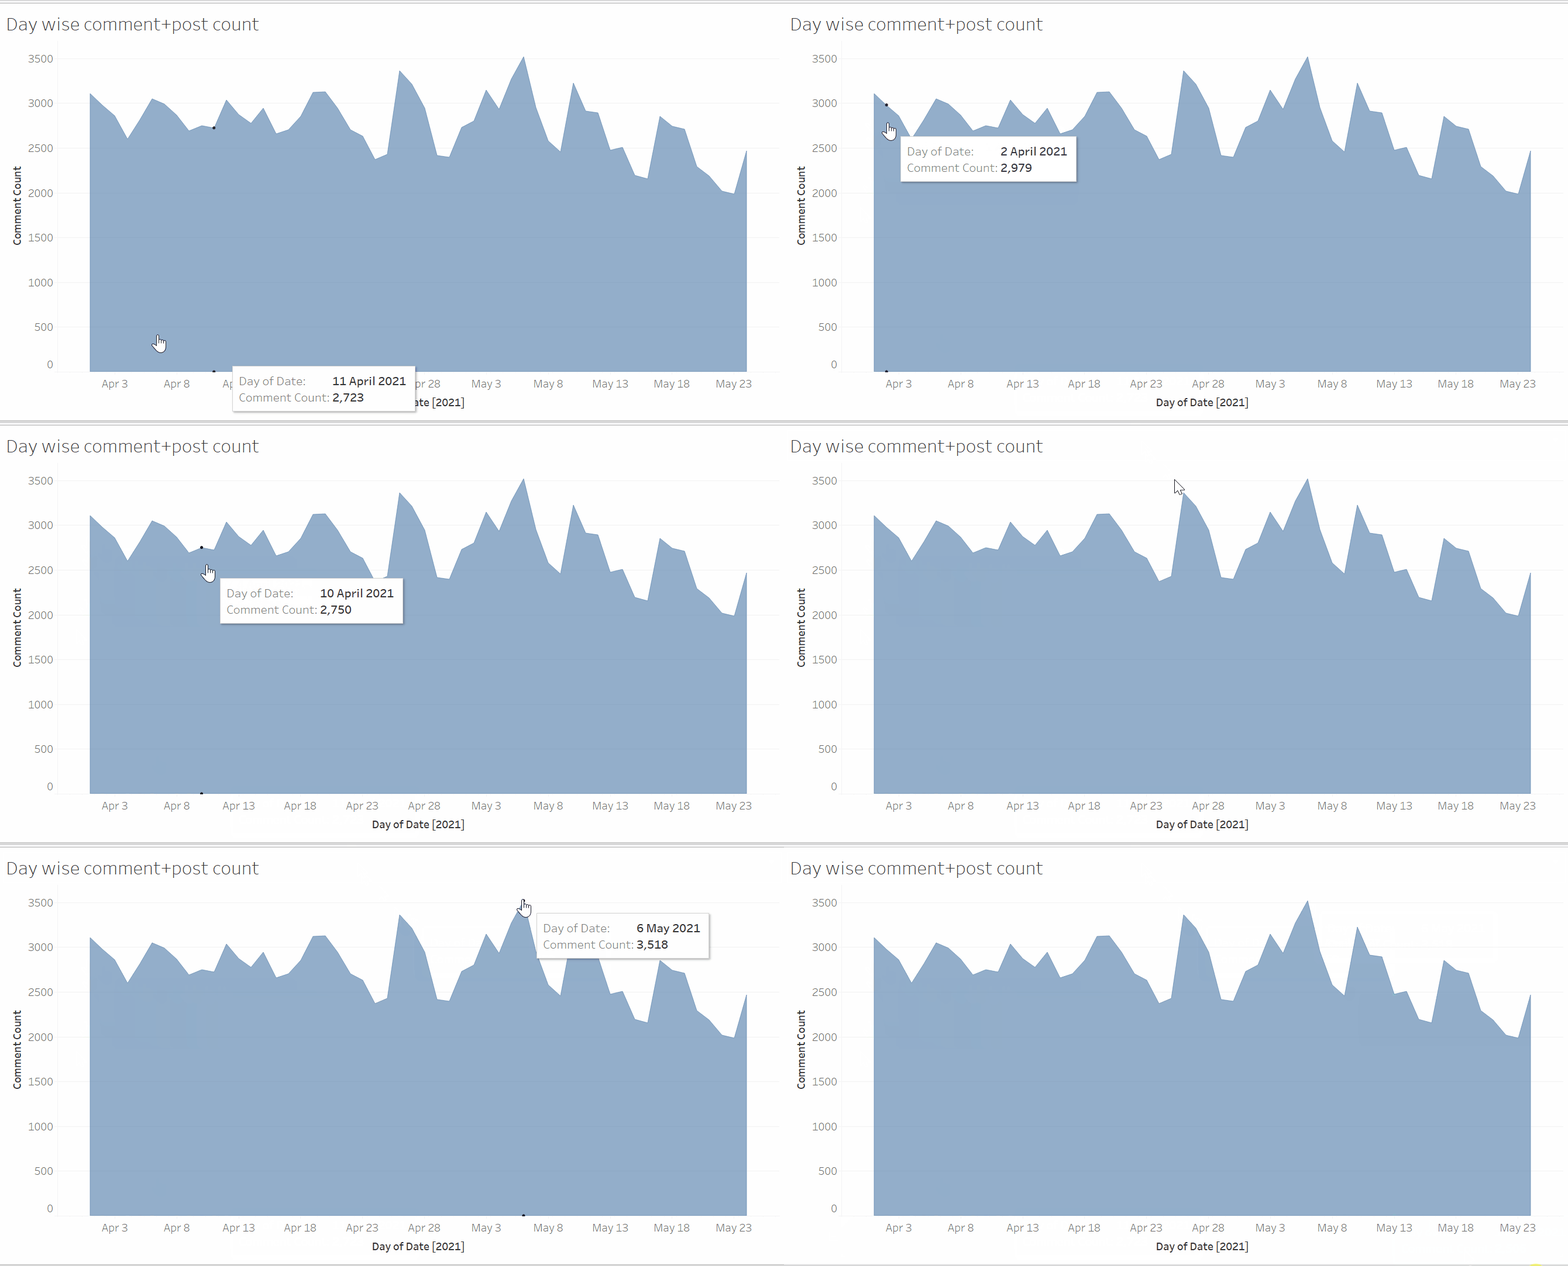
So clearly it looks very similar and doesn't tell us much . It is just up and down and up and down , lot of variance .
You have to note that this contains all comments made from LeoFinance irrespective of frontend used . If frontend used is taken into count , this will reduce by almost 2.5 to 3 times .
LEO_USD and Comment count
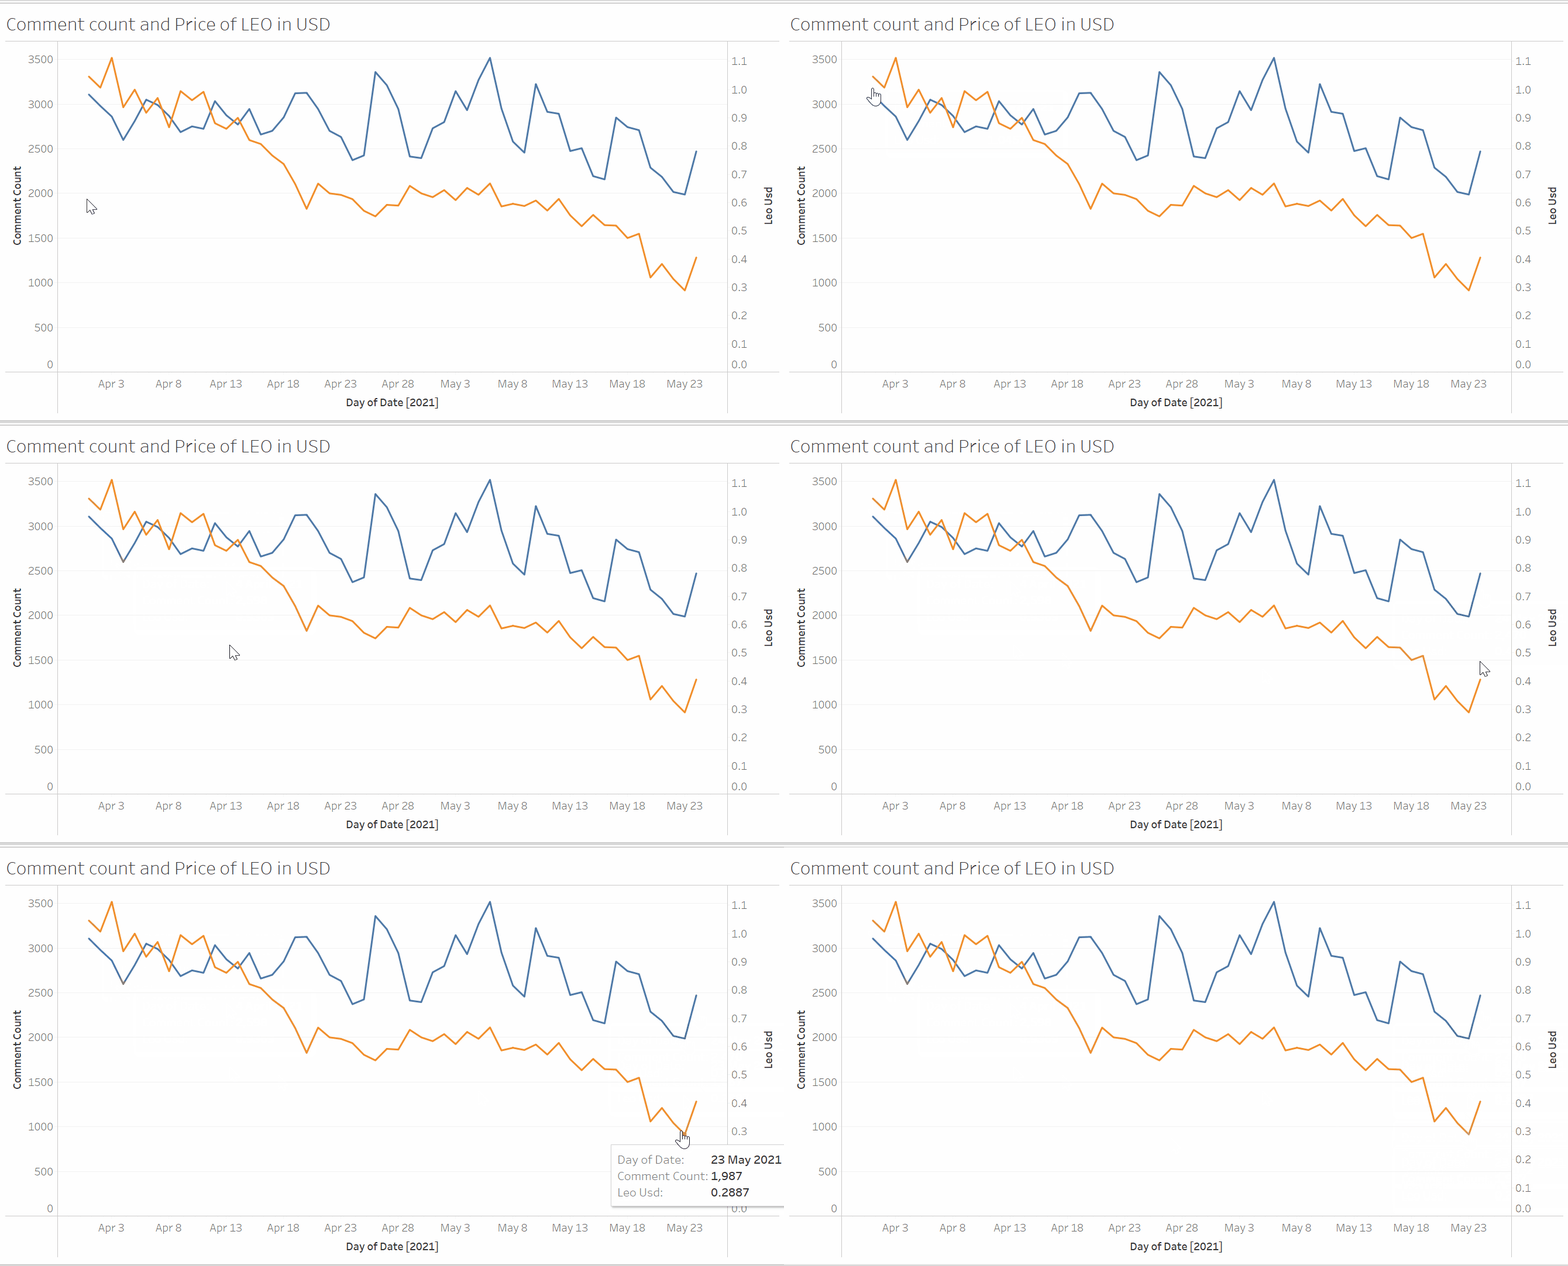
Orange line is the LEO to USD price and Blue line is the activity on LeoFinance .
Well although at particular points it may seem like they correlate , no real strong point to declare it is affecting each other .
Linear regression
This is the actual part which can tell us the correlation
Let us take a look at LEO price in USD vs Comment count
Now pay close attention to this .
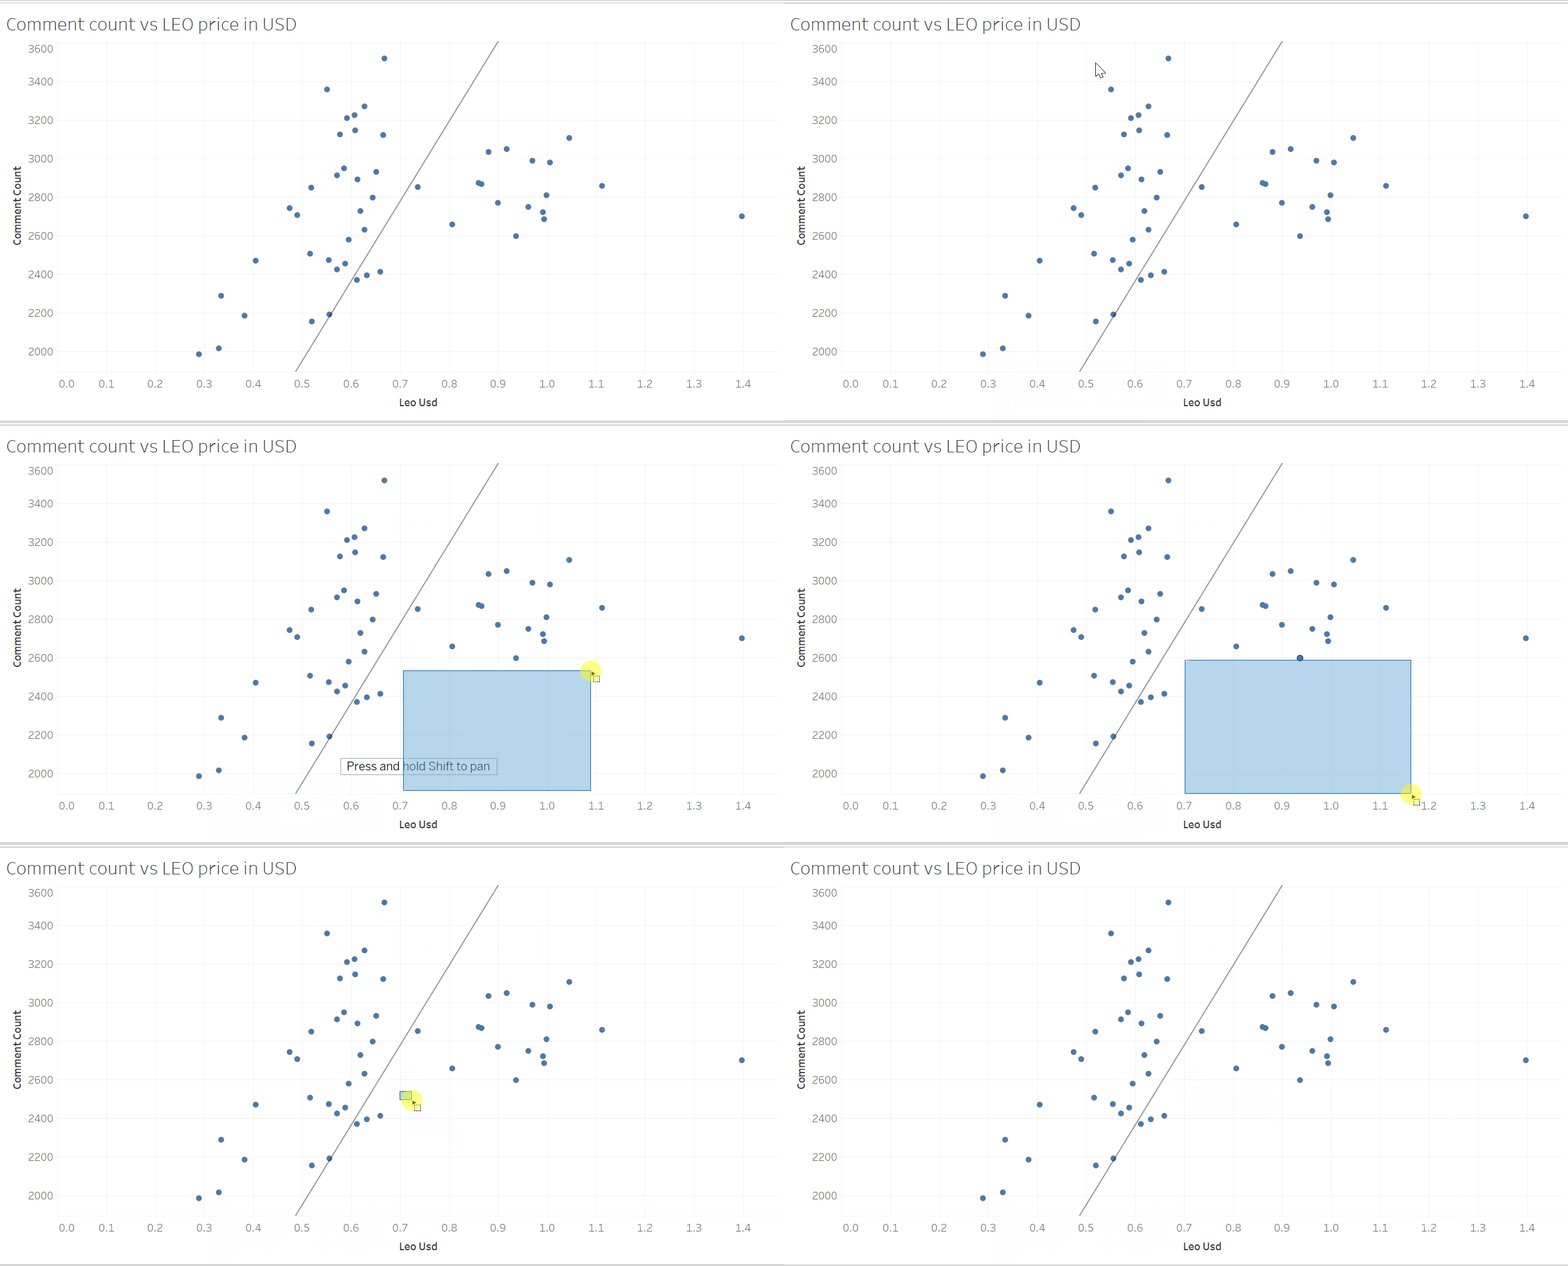
The lowest activity you can see was 1987 comments and 2016 comments per day and they were when the LEO price was the lowest too .
Also I have stressed on a particular portion of the chart if you observe . The 0.7 PRICE part , I keep on drawing rectangles there . It tells us that when LEO price was 0.7$ and above we never had a day in which the activity was less than 2600 . Never after April 1st .
But still not convincing ?
This is what statistics say
R2 - which is Coefficient of Determination tells us how much one variable variation impacts the other variable .
R2 value for LEO activity is 0.134 which means LEO USD price affects comment count 13.4% .
Is 13% more or less ? I will leave it to you but according to statistics ( the P value is less than level of significance ) , there is a significant amount of correlation between these two variables .
Who counts LEO to USD ? Give us LEO in HIVE Price .
Alright , let us take a look at that too -
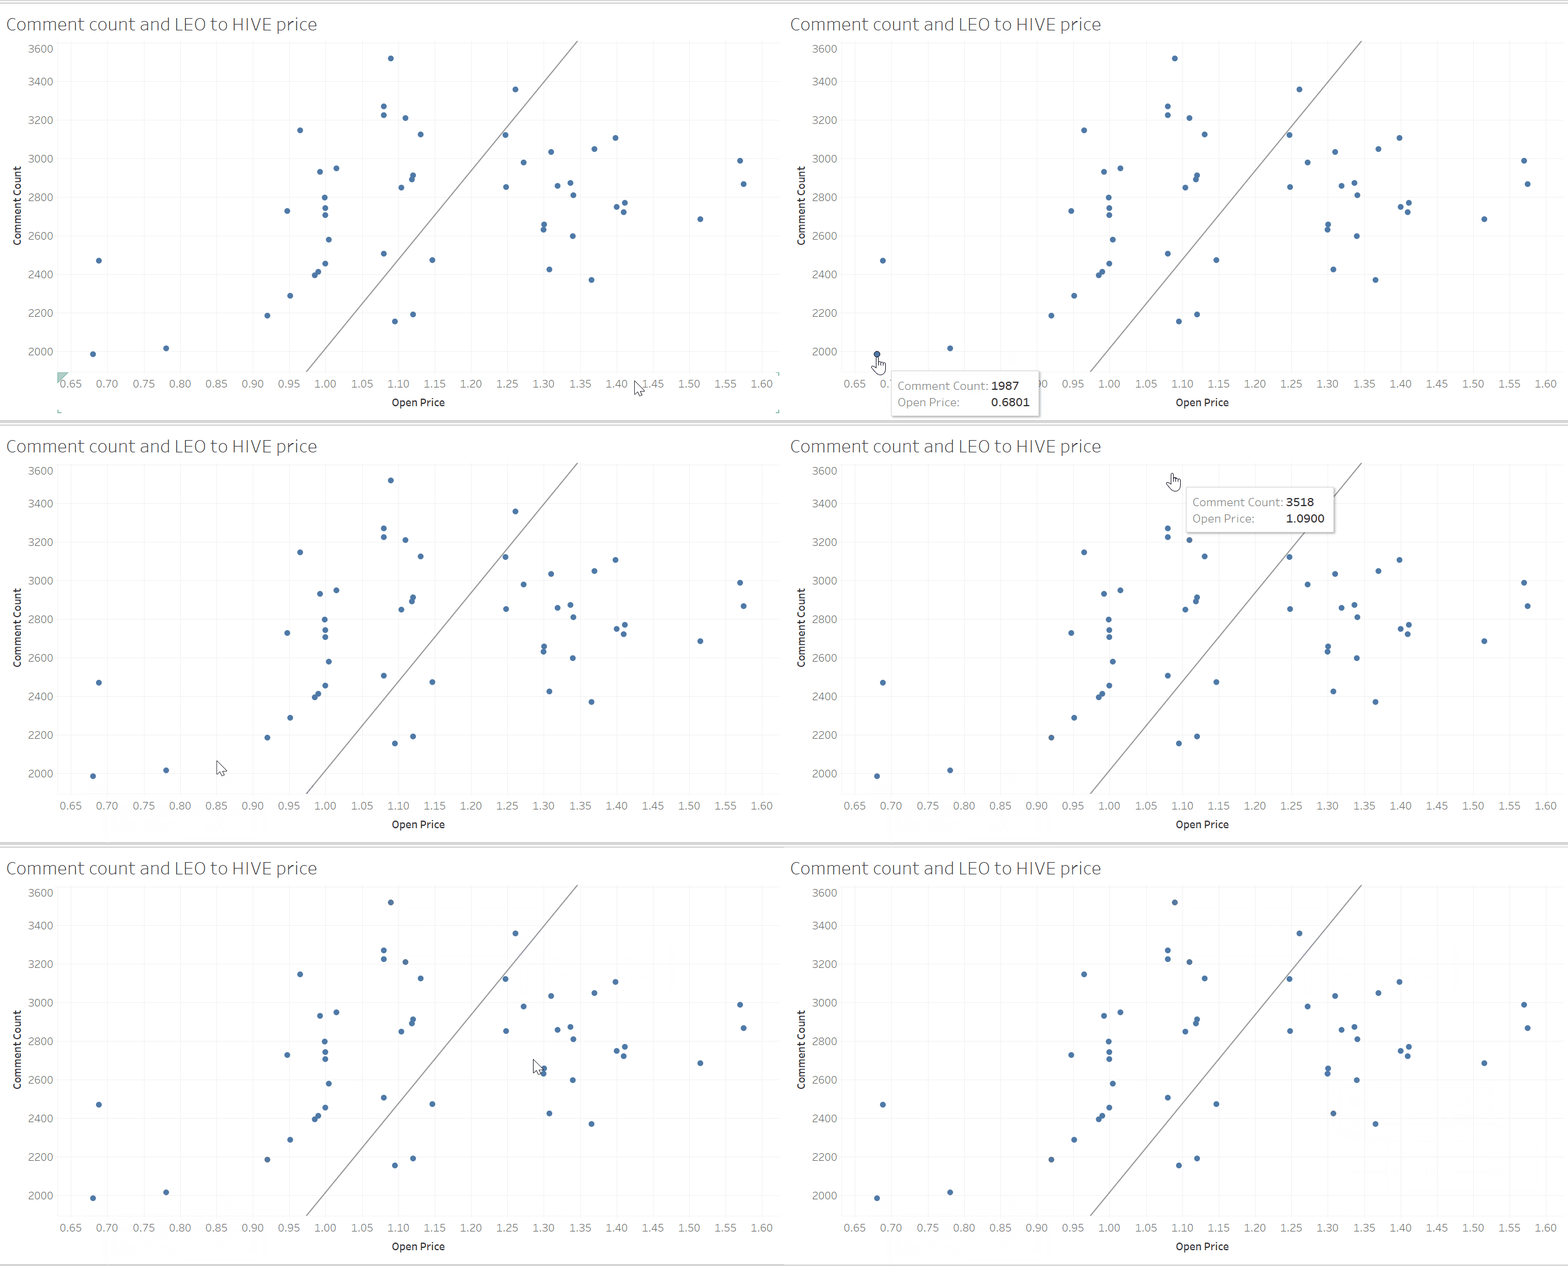
Now the graph may seem a little bit different to you but the outcome ? The exact same .
The R2 hasn't changed at all , it is still 0.13 which means the LEO price ( in Hive ) affects the LeoFinance activity by 13% .
P- value is once again lesser than level of significance so the impact is real .
Well yeah the activity might be less but users aren't leaving the number of users are same .
Well okay let us take a look at that . Let us take a look at number of unique authors who posted on LeoFinance vs the LEO price ( in HIVE )
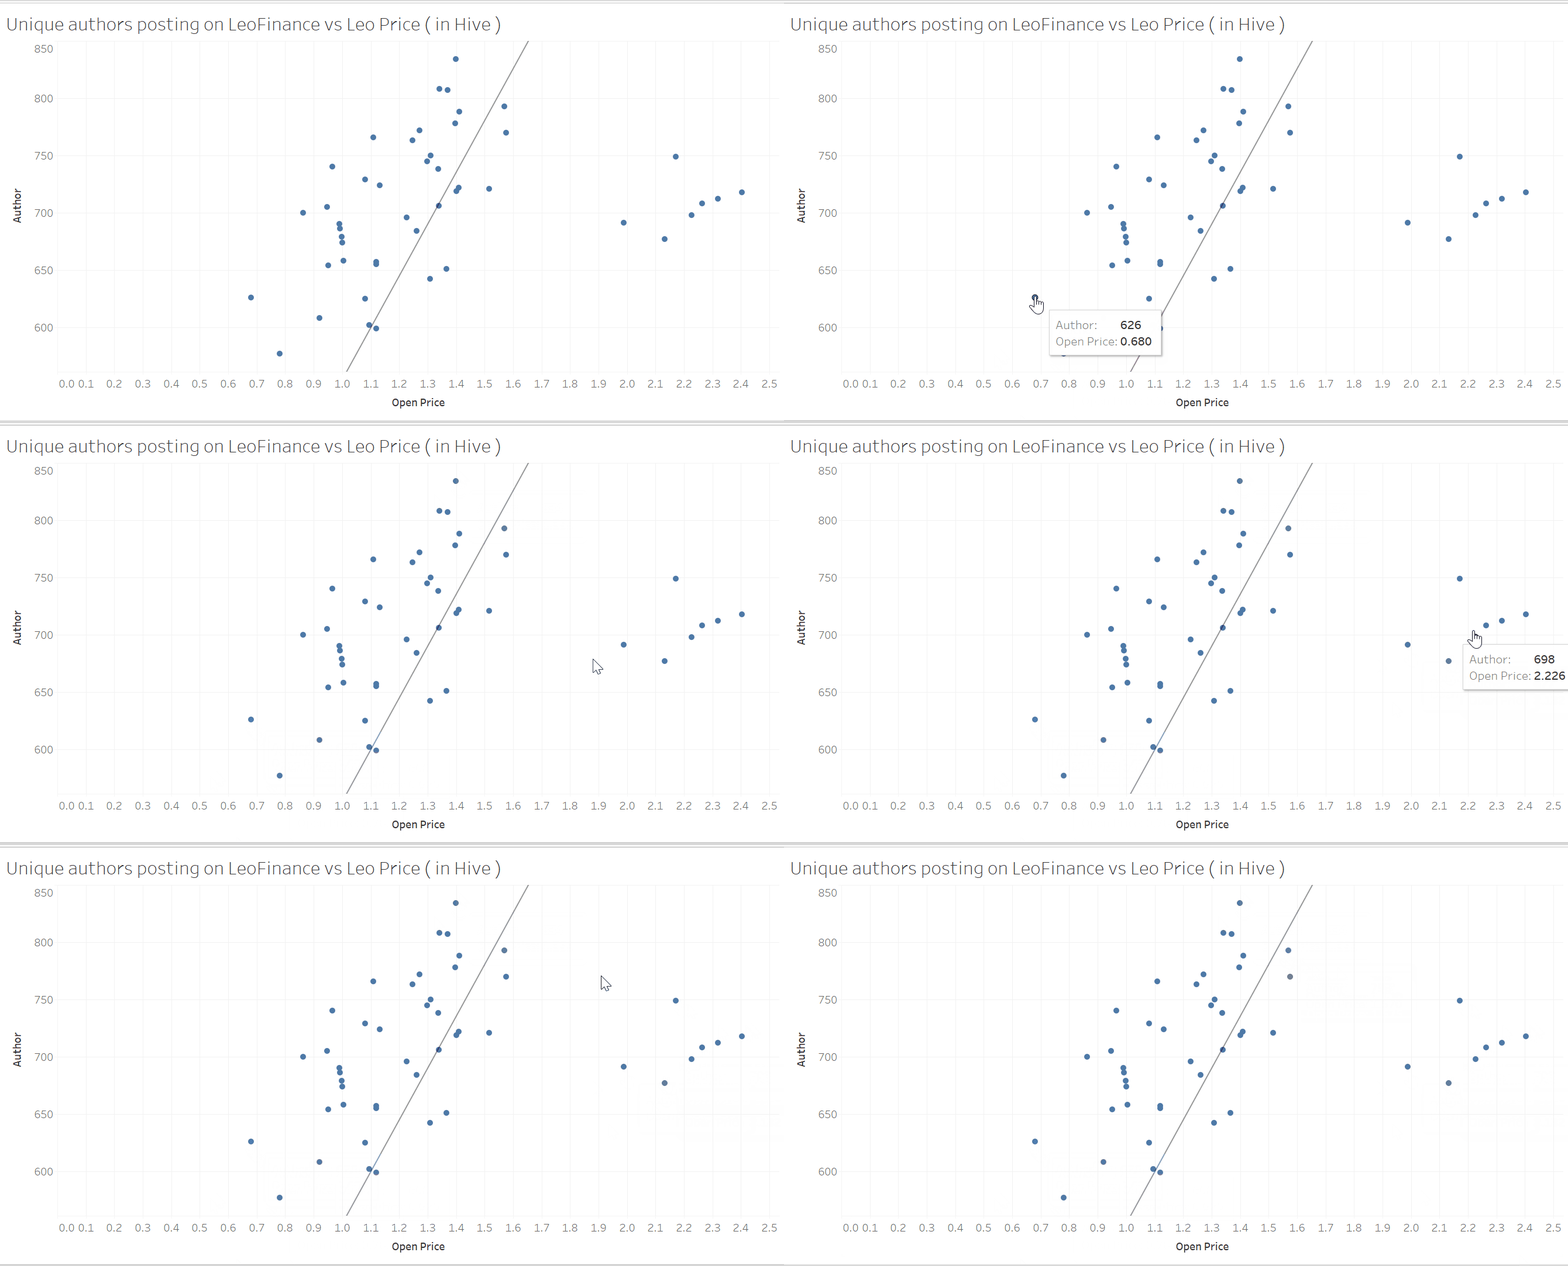
I will come straight to the point . The p value is less than level of significance which means " Leo price does have an impact on number of users " .
The R2 value is 9% though which is good which means the impact of price on activity is more than impact of price on users which also means users hop on but tend to be less active than before .
Note: I arrived at the R2 and P value by writing code in python as well as cross verifying it in Tableau software.
That's it from me today . I thought of including Hive activity vs Hive price too but the post will become way too long . So I will post that tomorrow if you guys liked this analysis , let me know in comments if you would like to see it : )
Regards,
MR.
Posted with STEMGeeks
Your content has been voted as a part of Encouragement program. Keep up the good work!
Use Ecency daily to boost your growth on platform!
Support Ecency
Vote for Proposal
Delegate HP and earn more
Very good analyses. With the price movements there is always some movement in number of comments and posts. This could be just talk about the upward rise of price and excitements.
Thanks for sharing.
!LUV 1
Thanks harpreet , we will see the price come back to its original price again soon but till then we should not give up hope and keep pushing ourselves to be active .
Posted Using LeoFinance Beta
Hi @amr008, you were just shared some LUV thanks to @harpreetjanda. Holding at least 10 LUV in your wallet enables you to give up to 3 LUV per day, for free. See the LUV in your wallet at https://hive-engine.com or learn about LUV at https://peakd.com/@luvshares
💥Boom💥
and
💥Boom💥
Thanks a lot @onealfa :) My first official double boom .
Posted Using LeoFinance Beta
Nice to see that there is some math to back up what I have been noticing lately on the chain. The main way I knew it was happening was because my VP has been sitting higher than usual. That means less people are posting so I am curating less. It also means less people are commenting so I am upvoting those less too. Thanks for sharing this!
Posted Using LeoFinance Beta
Yeah I agree but that also means that this is the best time to be active , less people so more LEO per user .
Will do the analysis for this too today or tomorrow .
Posted Using LeoFinance Beta
Finally I can throw this at the master of tasks whenever he says prices are not important :P We have proof that prices affect activity which is one of the most important things on a social network
Posted Using LeoFinance Beta
Lol that's true . It is unfortunate though , people giving the first priority to price because then it will be extremely difficult for Hive to be a true "social" media .
Posted Using LeoFinance Beta
i always look forward to your statistical analyses. your posts were one of the reasons i came to Hive in the first place, as having people engaged in understanding their system is integral to long term growth. you are doing a service to all Hive users.
and this probably goes without saying, but yes please post the Hive activity vs Hive price analysis.
Posted Using LeoFinance Beta
Very happy to hear this @lerkfrend .
Either today or tomorrow , it will be out :)
Posted Using LeoFinance Beta
I appreciate your efforts.
Thanks for sharing
!LUV
My pleasure @guurry123 :) If you found the post useful in someway then I am happy .
Posted Using LeoFinance Beta
Hi @amr008, you were just shared some LUV thanks to @guurry123. Holding at least 10 LUV in your wallet enables you to give up to 3 LUV per day, for free. See the LUV in your wallet at https://hive-engine.com or learn about LUV at https://peakd.com/@luvshares
I'm surprised you infer the direction of causality.
You can't do that from this data surely?
Obviously it makes more intuitive sense to infer that it's price going down that makes users post less, but technically it could be the other way around!?
Somehow?
Please pardon me , I don't think I understood what you really meant by this .
Can you reframe it please?
Posted Using LeoFinance Beta
What i mean is you've got the data that shows a correlation between the two variables but you can't infer from the data the direction of 'causality'. You'd need time relevant data for that.
Hey no time series isn't always a necessary factor to calculate the relation between two factors .
Any two independent variable can be taken for finding the coefficient of determination . Coefficient of determination is used to measure the direction and magnitude of causality . It is there to show us how much one factor is affecting other factor .
How can it do that ? It does by taking the whole data into picture ( like training and testing the dataset in Machine Learning ) .
Coefficient of determination comes under Machine Learning itself .
Posted Using LeoFinance Beta
Gotcha cheers!
I wonder if you can get data from Discord? To then see if when there is a drop in activity on Leo (and Hive) is there is a rise in activity on the chat platform of choice for people here.
I see it like a rainy day. People tend to stay indoors so though activity at a park would be down, it is logical to then see activity at libraries, cafes, cinemas etc go up.
So my point in all this?
If the platform facilitated connectivity without relying on external systems to maintain that, then there mightn't be visible drops like your stats show. The fundamental of retaining attention is then a missing factor.
You've clearly shown that the money game is the priority in these places and that it's very susceptible to failure or negative movement.
Which is why I continue to make the point that the tools for sociability and connectivity ONCHAIN need to be a development priority on these so called "superior web3.0 dapps."
For a particular chat room ? Yes we can get that data . That's a very interesting take , would be cool to see it but it will be a bit difficult to get them , I will try once .
Exactly , you are totally right about this . What people are concentrating now is purely on price of tokens , this isn't a "social media" in complete sense yet .
Posted Using LeoFinance Beta
Very interesting analysis. I didn't necessarily need to see this because I can tell from my own feelings towards the markets. Most of us don't plan on selling anytime soon but there is only so long that you can take getting slapped across the face by a 2x4 before you say, "You know what? I'm not going to pay attention for a few days and let it come back." We all have the belief it will else we'd all be selling. But no one likes to see negative news every day. It's just human nature. And most of us have other ways we could (and maybe should) be utilizing our time so when it's gloomy in the markets, it's a good time to focus on other things that need our attention.
In the meantime, this is certainly the BEST time to be and stay active. As you say, the rewards go up and the potential attention from other people isn't nearly as competitive.
Love the info, as always! Your posts are always worth every dime they earn.
Posted Using LeoFinance Beta
I'm not on leo much but i do notice a drop in activity on the POB side as well. I suppose it is only natural as the price drops there'll be folks focusing their attention elsewhere.
Although, as another comment pointed out, it could be the other way around. As folks focus their attention elsewhere, the price drops.
That is possible but very unlikely I guess.
Yeah overall Hive has been affected .
Posted Using LeoFinance Beta
Great analysis! Activity might be corelated to the price of token which is quite common for new users. Well done!
Posted Using LeoFinance Beta
Very good analyses.Thanks for sharing.
Posted Using LeoFinance Beta