[SPA-ENG] "Citizen Science" Project - Report - Part Four | Reporte - Cuarta parte
Este es mi reporte de la cuarta parte del proyecto de ciencia ciudadana. En la parte anterior, instalamos MadAnalysis5 e hicimos una pequeña prueba de su funcionamiento. Para más detalles, pueden leer mi reporte o el de cualquiera de mis compañeros de proyecto en la etiqueta #citizenscience. En esta parte, vamos a usar MadAnalysis5 para analizar los datos que obtuvimos en la segunda parte. Para más detalles sobre el proyecto, pueden ingresar a este post de @lemouth, que es quien está liderando este experimento en Hive.
This is my report of the fourth part of the citizen science project. In the previous part, we installed MadAnalysis5 and did a small test of its operation. For more details, you can read my report or the report of any of my project colleagues in the tag #citizenscience. In this part, we are going to use MadAnalysis5 to analyze the data we obtained in the second part. For more details about the project, you can go to this post by @lemouth, who is leading this experiment at Hive.
El contenido del evento - tarea 1 | The event content - task 1
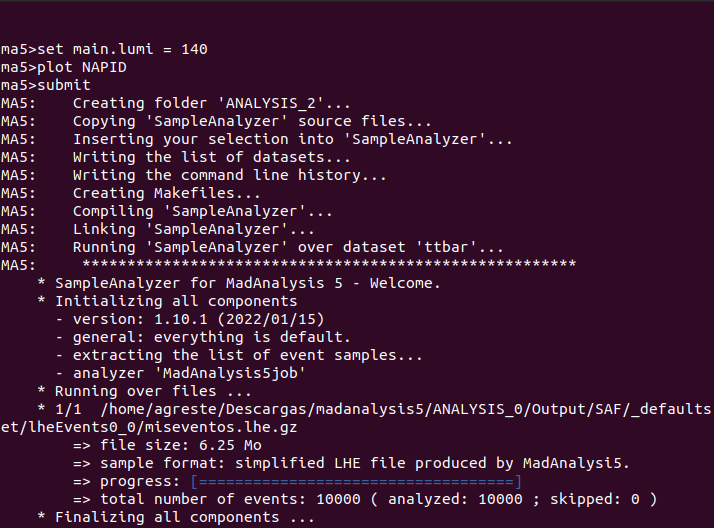
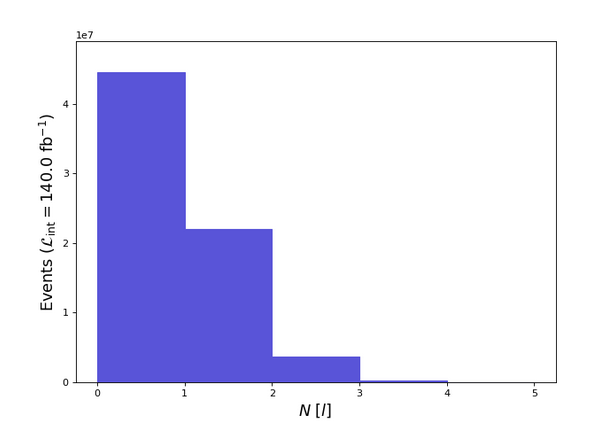
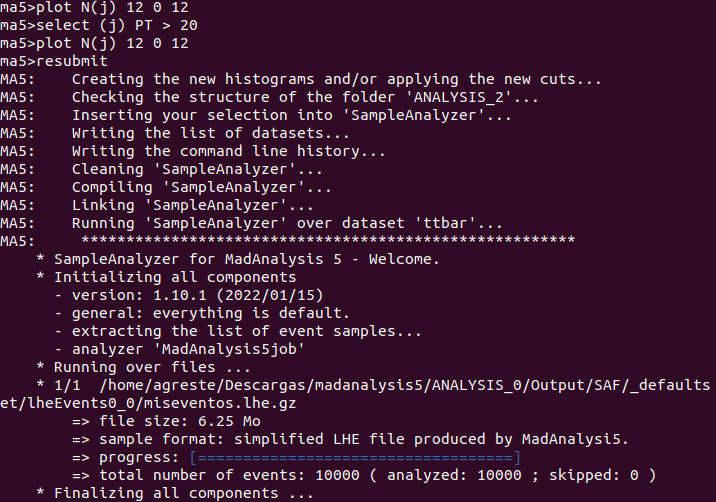
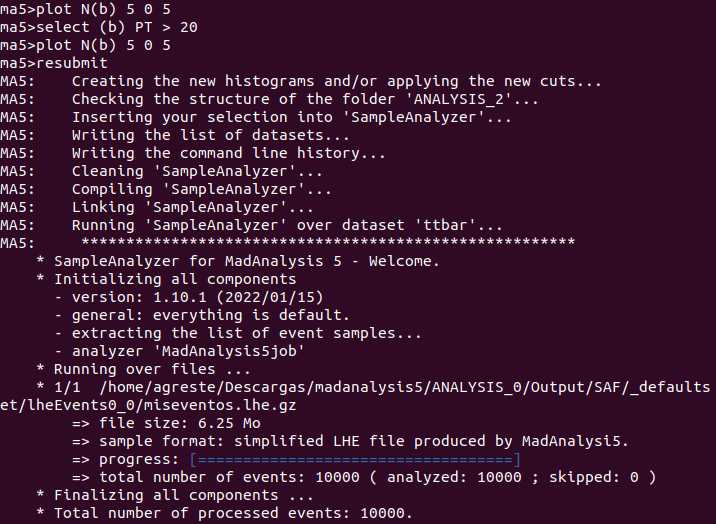
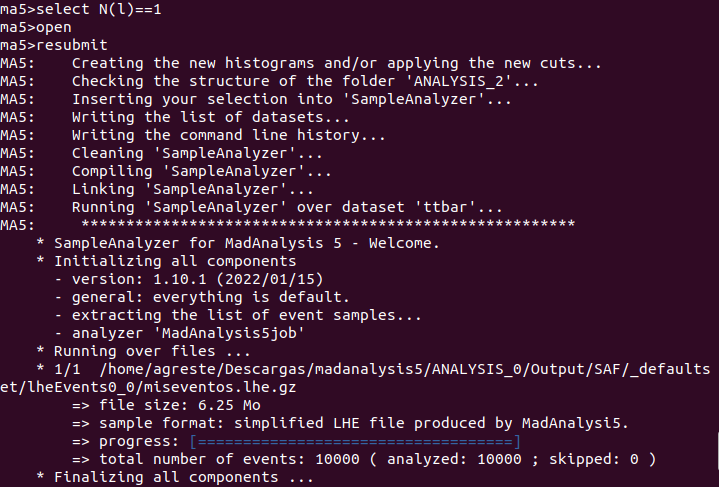
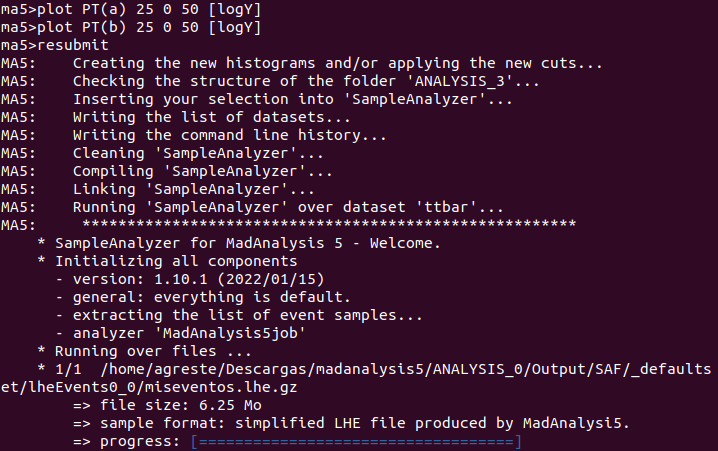
Para la primera tarea, inicié MadAnalysis5 (./bin/ma5) e importé miseventos.lhe.gz, tal como había hecho al final del episodio anterior. Al igual que en esa ocasión, generé un gráfico, pero esta vez seteando la luminosidad a 140 fb-1.
For the first task, I started MadAnalysis5 (./bin/ma5) and imported myevents.lhe.gz, as I had done at the end of the previous episode. As on that occasion, I generated a graph, but this time setting the luminosity to 140 fb-1.
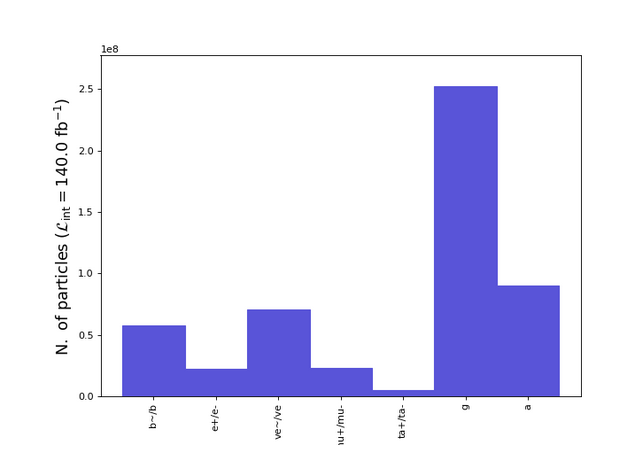
El gráfico coincide con el de lemouth y con lo esperado: una gran cantidad de jets, seguida por fotones y energía perdida. Luego, muchos b-jets, una cantidad similar de electrones y muones, y finalmente pocos taus. Para una explicación de por qué esto es lo esperado, los remito al post de lemouth enlazado más arriba.
The graph coincides with lemouth's and with what was expected: a large number of jets, followed by photons and lost energy. Then, many b-jets, a similar amount of electrons and muons, and finally few taus. For an explanation of why this is expected, I refer you to the lemouth post linked above.
Multiplicidad de leptones y fotones - tarea 2 | Lepton and photon multiplicity - task 2
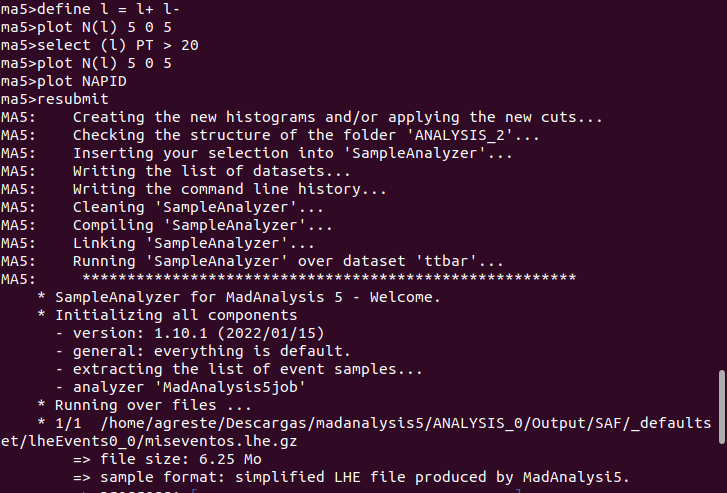
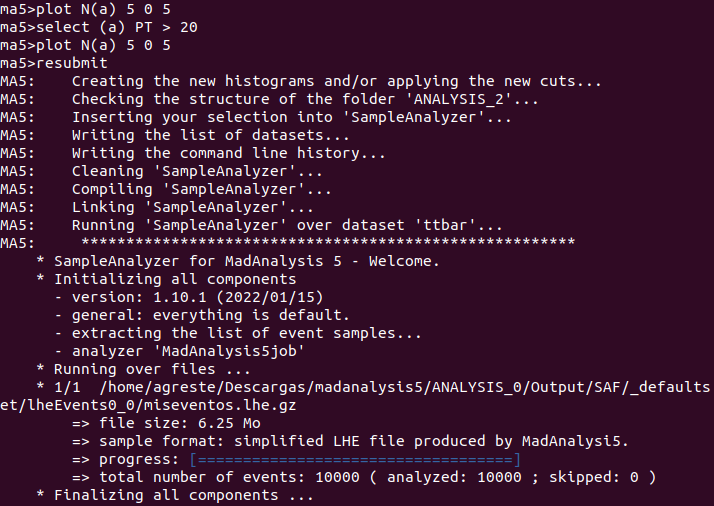
Para esta tarea hay que limpiar el set de objetos interesantes ignorando aquellos que tienen un momento transverso menor a 20 GeV. De nuevo, los remito al post de lemouth donde esta decisión está explicada.
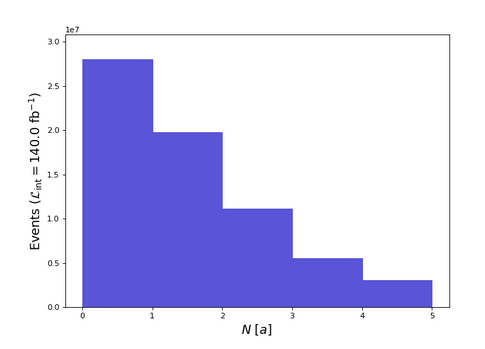
Primero, implementé esta restricción para los leptones y creé un histograma de 5 barras, primero sin la restricción y luego con la restricción, de modo que se pueda apreciar el corte.
For this task we have to clean the set of interesting objects ignoring those with a transverse momentum smaller than 20 GeV. Again, I refer you to lemouth's post where this decision is explained.
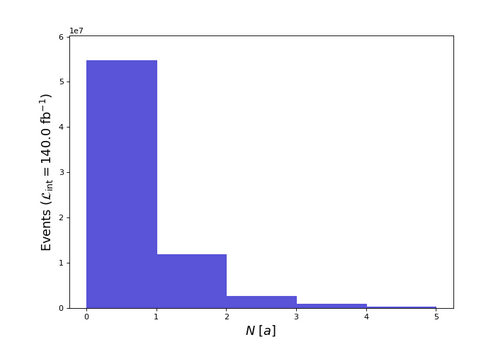
First, I implemented this restriction for the leptons and created a 5-bar histogram, first without the restriction and then with the restriction, so that the cutoff can be appreciated.
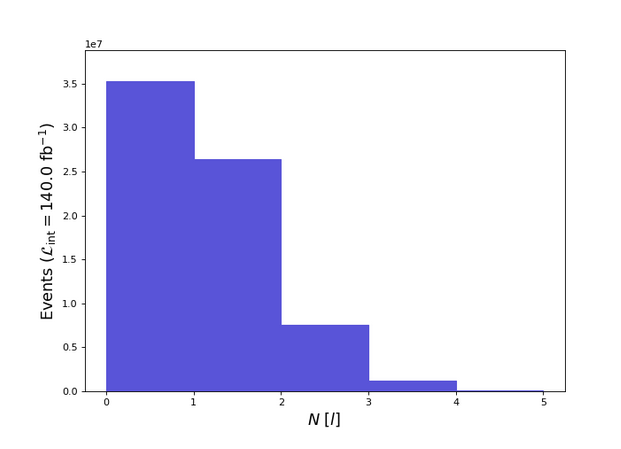
En los gráficos se puede apreciar cómo aumenta la cantidad de eventos que tienen 0 leptones como estado final y disminuye el resto.
The graphs show how the number of events with 0 leptons as final state increases and the rest decreases.
Luego, hice lo mismo con los fotones.
Then, I did the same with photons.
Y obtuve estos gráficos. Al igual que en el caso anterior, aumenta la cantidad de eventos con 0 fotones como estado final.
And I obtained these graphs. As in the previous case, the number of events with 0 photons as the final state increases.
Multiplicidad del jet - ejercicio 1 | Jet multiplicity - homework 1
Ahora llegó el momento de hacer lo mismo para los jets y los b-jets, esta vez sin la guía de lemouth. Empecé con los jets. Después de una prueba, decidí hacer un gráfico de 12 barras. La primera vez que hice el gráfico dejé el valor de 20 GeV. Curiosamente, no encontré diferencias con el gráfico sin recortar, pero esas diferencias sí aparecen a 25 GeV. De modo similar a los otros casos, se observa una migración de eventos de derecha a izquierda.
Now it was time to do the same for the jets and b-jets, this time without the lemouth guide. I started with the jets. After a test run, I decided to make a 12-bar chart. The first time I made the graph I left the value at 20 GeV. Interestingly, I found no differences with the untrimmed graph, but those differences do appear at 25 GeV. Similar to the other cases, a migration of events from right to left is observed.
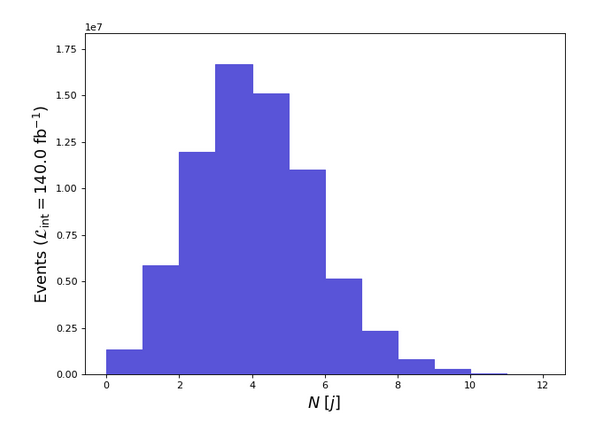
20 GeV:
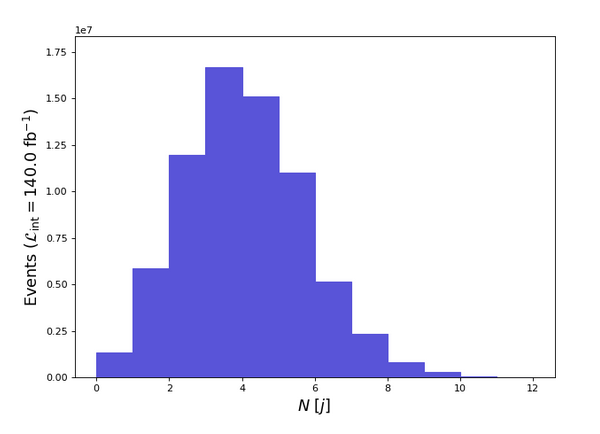
25 GeV:
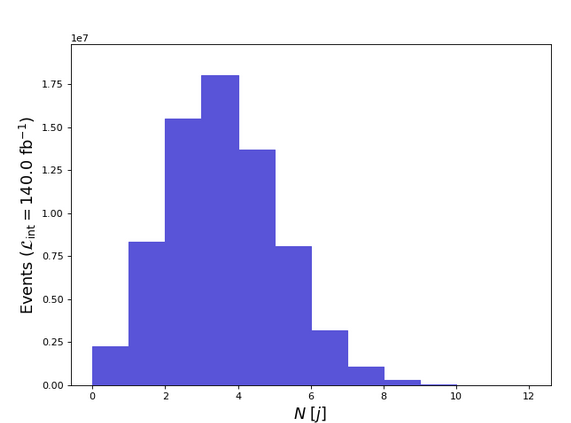
Finalmente, hice los gráficos para los b-jets (en este caso, volví a 5 barras). Casi no hay diferencias entre los gráficos, ni a 20 ni a 25 GeV. Esto entiendo que significa que los b-jets son muy energéticos, aunque no sé explicar por qué. Tengo que admitir también que el gráfico no es el que esperaba. Dado que cada quark top o antitop decae en un b-quark y un W boson, y cada b-quark da origen a un b-jet, esperaba que todos los eventos tuvieran 2 b-jets. Entiendo que esta frase de lemouth explica que no sean siempre 2: “Some of the b-jets are then identified as light (i.e. normal) jets.” Pero de todos modos no esperaba que hubiera más eventos con 0 o 1 que con 2, ni mucho menos que hubiera algunos pocos eventos con 3 b-jets.
Finally, I made the graphs for the b-jets (in this case, I went back to 5 bars). There is almost no difference between the graphs, neither at 20 nor at 25 GeV. I take this to mean that the b-jets are very energetic, although I don't know how to explain why. I have to admit also that the graph is not what I expected. Since each top or antitop quark decays into a b-quark and a W boson, and each b-quark gives rise to a b-jet, I expected all events to have 2 b-jets. I understand that this sentence from lemouth explains that they are not always 2: "Some of the b-jets are then identified as light (i.e. normal) jets." But anyway I would not expect that there would be more events with 0 or 1 than with 2, let alone that there would be some few events with 3 b-jets.
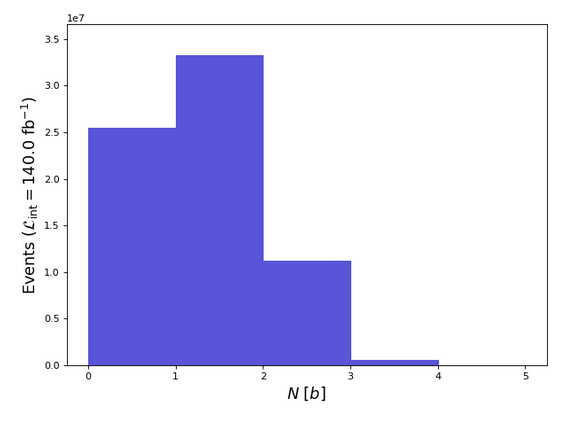
20 GeV:
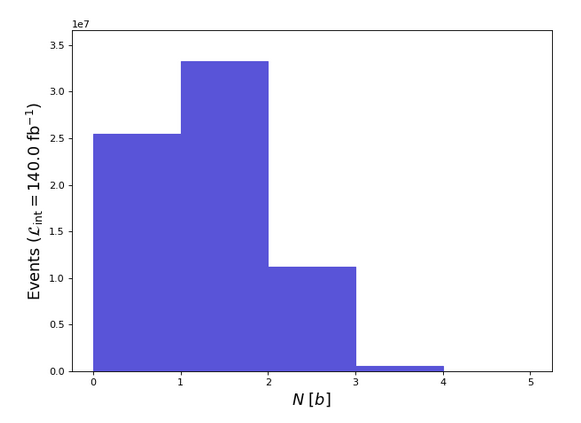
25 GeV:
Selección de un subconjunto de todas las colisiones simuladas - tarea 3 | Selection of a subset of all simulated collisions - task 3
La idea ahora es centrarse en el subset de eventos que producen un leptón, un neutrino y un b-jet, por un lado, y un b-jet y 2 light-jets por el otro. Esto se logra indicando que solo tiene que haber un leptón (electrón, muón, tau). Ese leptón va acompañado en los tres casos de un neutrino. Si no hay un segundo leptón, entonces tiene que haber 2 light-jets. En los dos casos, se produce además un b-jet.
The idea now is to focus on the subset of events that produce a lepton, a neutrino and a b-jet, on the one hand, and a b-jet and 2 light-jets on the other. This is achieved by indicating that there has to be only one lepton (electron, muon, tau). That lepton is accompanied in all three cases by a neutrino. If there is no second lepton, then there must be 2 light-jets. In both cases, a b-jet is also produced.
Multiplicidad de leptones después del recorte - ejercicio 2 | Lepton multiplicity after the cut - homework 2
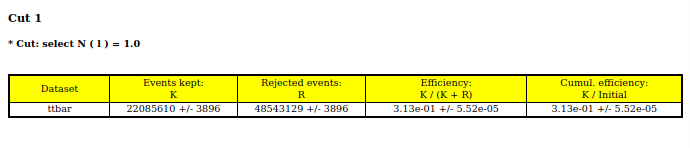
Habiendo seleccionado solo los eventos que tienen 1 leptón, es de esperar que en el gráfico solo sea mayor a 0 la barra del 1. Y eso es exactamente lo que sucedió.
Having selected only the events that have 1 lepton, it is to be expected that only the 1 bar will be greater than 0 in the graph. And that is exactly what happened.
Propiedades de leptón - tarea 4 | Lepton properties - task 4
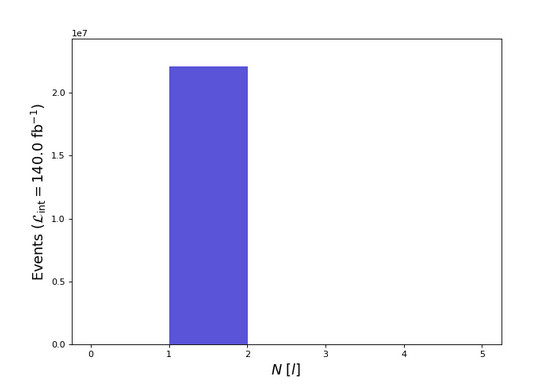
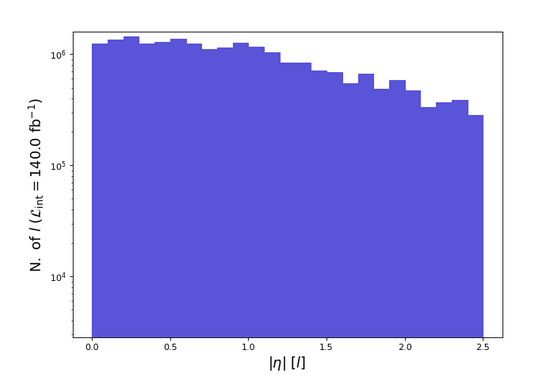
Vamos a investigar ahora dos propiedades del leptón: el momento transverso y la pseudo-rapidez.
We will now investigate two properties of the lepton: the transverse momentum and the pseudo-rapidity.
Transverse momentum:
Pseudo-rapidity
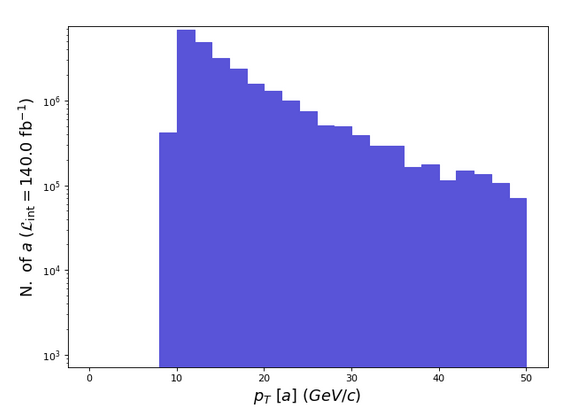
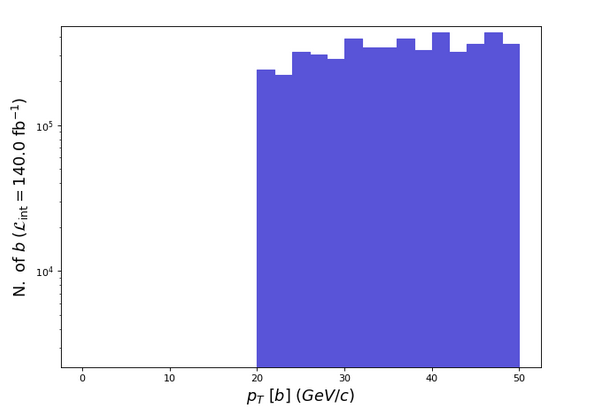
En este punto se me ocurrió que podría usar el gráfico del momento transverso para volver sobre la tarea relacionada con los b-jets. Si el gráfico de los b-jets no cambiaba mucho cuando se hacía el recorte en 20 GeV y apenas en 25 GeV, entonces eso debería verse reflejado en estos gráficos. Armé también un gráfico para los fotones para poder realizar una comparación.
At this point it occurred to me that I could use the transverse momentum plot to revisit the task related to b-jets. If the b-jets plot did not change much when clipping was done at 20 GeV and just barely at 25 GeV, then that should be reflected in these plots. I put together a plot for photons as well so that a comparison could be made.
Y, en efecto, vemos que en el gráfico de los fotones hay una buena cantidad menor a 20 GeV, pero no así en el gráfico de los b-jets.
And, in fact, we see that in the photon plot there is a good amount less than 20 GeV, but not so in the b-jets plot.
Photons:
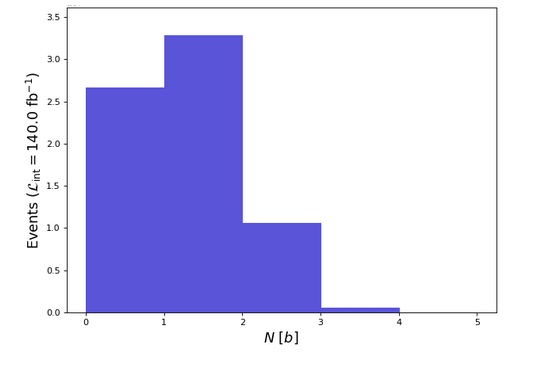
B-jets
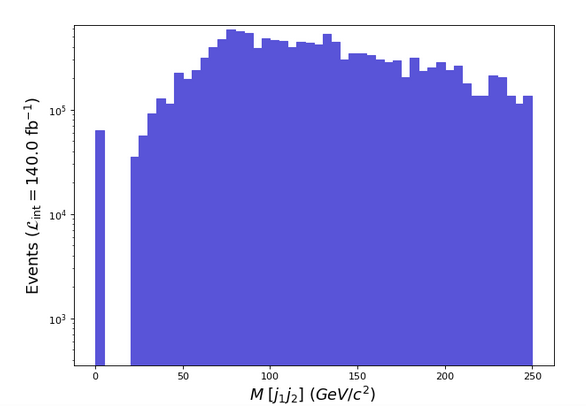
Volviendo al trabajo, ahora toca investigar la masa de los dos light jets, que combinadas deberían ser equivalentes a la masa del bosón W del que provienen. Eso debería verse como un pico en el histograma alrededor de los 80 GeV, y es lo que efectivamente muestra el gráfico.
Back to work, it is now time to investigate the mass of the two light jets, which combined should be equivalent to the mass of the W boson they come from. That should be seen as a peak in the histogram around 80 GeV, and that is indeed what the graph shows.
Espectro de la energía transversa faltante - ejercicio 3 | Missing transverse energy spectrum - homework 3
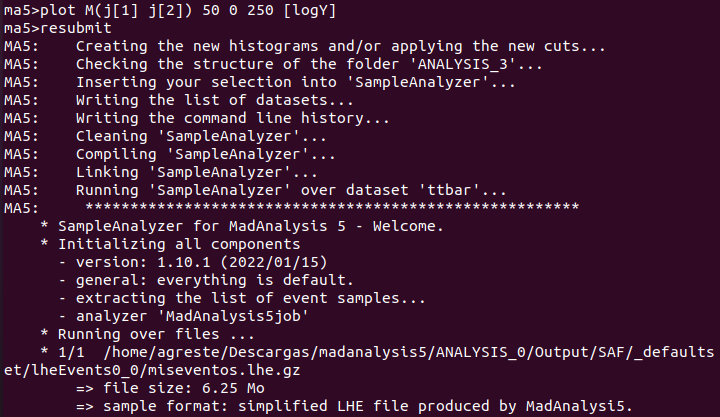
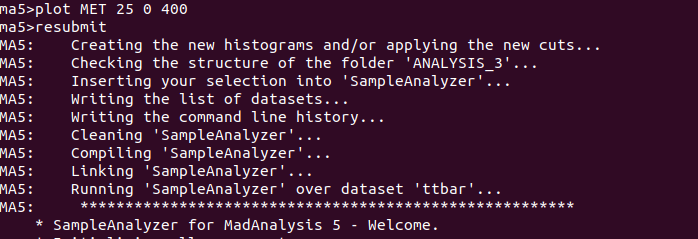
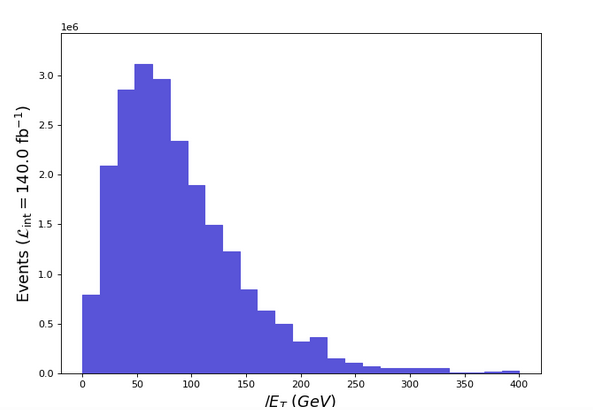
La última tarea era hacer un plot para la energía transversa faltante. Entiendo que esta energía corresponde a los neutrinos, que son muy difíciles de detectar, y que se espera que se produzcan junto con los leptones cuando decaen los top quarks. La energía debería conservarse, pero no sé cómo averiguar la energía total. Después de varias pruebas, el gráfico quedó como sigue:
The last task was to make a plot for the missing energy transverse. I understand that this energy corresponds to neutrinos, which are very difficult to detect, and are expected to be produced along with leptons when top quarks decay. The energy should be conserved, but I do not know how to find out the total energy. After several tests, the graph looked like this:
Congratulations for participating in this amazing project. I wish I had the ability. It is a wonderful thing!🌌
Thank you very much! I'm sure you have the ability. I don't have a scientific background, but a literary one, and here I am doing what I can and learning a lot in the process. Cheers!
Thanks for your contribution to the STEMsocial community. Feel free to join us on discord to get to know the rest of us!
Please consider delegating to the @stemsocial account (85% of the curation rewards are returned).
Thanks for including @stemsocial as a beneficiary, which gives you stronger support.
I was very happy to see your report popping up in my feed yesterday, although it happened right at the moment I turned off the computer. The present reply therefore took a night to get written (in particular as I had a lot to say ;) ).
First of all, thanks a lot for your hard work and everything you tried for free, without guidance (this was great to discover this!). I am amazed every time I see another report, and I was excited to see how you managed to deal with the assignments. Please find my feedback below.
This was indeed a nice way to plot this graph. Without going up to a maximum value for the X-axis above 10, the graph would have been truncated, with a lot of events populating the overflow bin (whose content can be accessed on the webpage generated by MadAnalysis5).
Checking the underflow and overflow bins is always useful! This is what I wanted everyone to notice.
The reason why selecting jets with a 20 GeV transverse momentum cut does not change anything is because we implemented such a restriction directly at the level of the simulation of our detector (this is part of the default behaviour). When we generated the
my_events.lhe.gzoutputfile, the code has been instructed not to write to the output file any jet with a transverse momenta smaller than 20 GeV. For that reason, the implementation of a jet transverse momentum cut with a 20 GeV threshold has no effect on the histogram.Does the above clarify why the behaviour you observed is the correct one?
The above also applies to b-jets (as they are jets after all). The graph with a 20 GeV selection is exactly equal to the graph without any selection. We can however notice small differences in the graph with a 25 GeV selection.
Each events has two true b-jets. However there is a probability that at least one of these is mis-tagged as a light jet. Assuming this mis-tagging probability to be 40%, we can immediately see than only about 35% of our events will end up in the 2-b-tagged jet bin, about 50% of them in the 1-b-tagged jet bin and about 15% of them in the 0-b-tagged jet bin.
What is happening in reality is different from the easy situation above. The mistagging probability is not a flat number, but is instead a function that depends on the properties of the jet. However, we can see that this yields to a similar qualitative behaviour: the majority of events end in the 1-b-tagged jet bin.
Parton showering (radiation) changes the picture a little bit, a few events migrating from one bin to another. It is also responsible for the very few events featuring three jets. However, this is a minor effect.
I hope my explanations helped you to understand the situation. Otherwise feel free to come back to me.
You made my day when you wrote that you played with the code by yourself to understand better your findings. I really mean it, and I was actually super excited to read this!
I guess the explanations I provided above should help you to conclude about the physical reason behind your findings for jets! For photons, what needs to ne known is that if their transverse momentum is below 10 GeV, then there is exactly 0% of chance to see them in the detector. This is why there is a cut-off at 10 GeV.
METwas indeed the right keyword to use. It was mentioned once in my blog, but I purposely did not insist too much on this. Gamification, in some sense...For your information, the total energy in the event can be obtained through the keyword
TET.Hi! Thank you very much for the detailed explanations. The graphs make much more sense now. I found that abrupt cutoff at 20 GeV odd, but I had no idea of the reason. I am left with doubts on the last part, would the total energy (TET) be the sum of the missing transverse energy and the transverse momentum of the lepton and the b-jet?
No, here it is defined differently. It consists of the same of the transverse energies of all visible final-state objects (the lepton, all jets, all photons, etc.). It is somewhat a way to assess the global activity in your event, and it is thus different from the missing transverse energy that is only related to the neutrinos (or dark matter for models including dark matter).
Thank you very much for the clarification. See you in the next part!
https://twitter.com/BenjaminFuks/status/1527209130087284736
The rewards earned on this comment will go directly to the person sharing the post on Twitter as long as they are registered with @poshtoken. Sign up at https://hiveposh.com.
Good to see your report as well. Still looking for a bit of time to analyze and respond to @lemouth's comment on my report accordingly.
I am looking forward to your reply, as well as to the reports of the others!
Thanks for the comment! I'll take a look at your report.